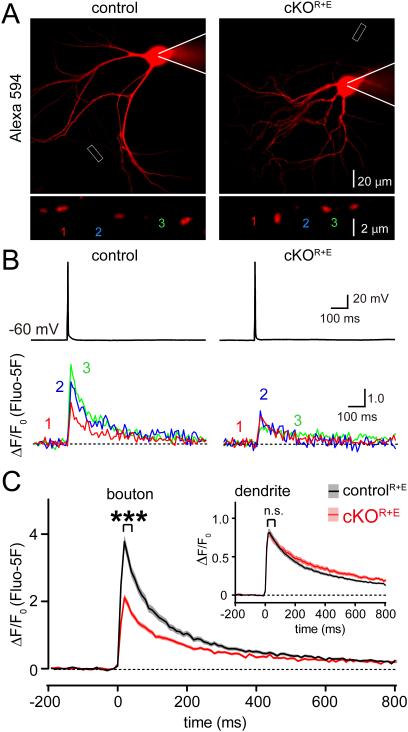
Figure 4. Impaired Ca2+ influx upon active zone disruption.
A. Sample images of cKOR+E and controlR+E neurons filled via patch pipette with Fluo-5F and Alexa 594 (red, top) and enlarged view of boutons (bottom) analyzed in B.
B. Somatic action potentials (top) and presynaptic Ca2+ transients imaged via Fluo-5F fluorescence (bottom) of the color coded boutons shown in A.
C. Summary plots of single action potential-induced Ca2+ transients in boutons, inset: same plot for dendrites. Data are shown as mean (line) ± SEM (shaded area). ***p < 0.001 for Ca2+ transients during the first 60 ms after the action potential as assessed by two-way ANOVA for genotype and time; interaction n.s. (boutons: controlR+E n = 202 boutons/16 cells/3 independent cultures, cKOR+E n = 157/13/3; dendrites: controlR+E n = 148 dendrites/16 cells/3 independent cultures, cKOR+E n = 100/13/3). All numerical data are in Table S4.

