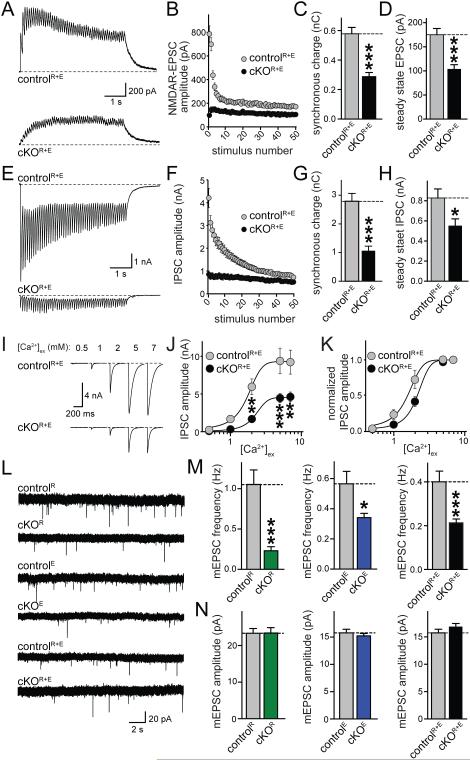
Figure 5. Release during action potential trains and mini release are sustained upon disruption of the active zone.
A-D. Sample traces (A) and quantitation of amplitudes (B), synchronous charge (C), and steady state EPSC amplitude (D, average of the last ten EPSCs) of NMDAR-EPSCs evoked by stimulation trains (10 Hz, 50 stimuli) in cKOR+E and controlR+E neurons (controlR+E n = 17/3, cKOR+E n = 18/3).
E-H. Analysis as in A-D but for IPSCs evoked by stimulation trains (10 Hz, 50 stimuli, controlR+E n = 19/3, cKOR+E n = 19/3).
I-K. Example traces (I) of action-potential evoked IPSCs at [Ca2+]ex of 0.5, 1, 2, 5, and 7 mM in cKOR+E and controlR+E neurons. Absolute IPSC amplitudes (J) and amplitudes normalized to the response at 7 mM [Ca2+]ex (K) are shown (controlR+E n = 8/3, cKOR+E n = 8/3).
L-N. Recordings of mEPSCs in synapses lacking RIM (cKOR), ELKS (cKOE), or both (cKOR+E). In each experiment, control neurons are identical to the respective cKO neurons except that the cre lentivirus is inactive in the control neurons. Sample traces (L) and quantitative analysis of mEPSC frequencies (M) and amplitudes (N) are shown (controlR n = 20/3, cKOR n = 21/3; controlE n = 25/3, cKOE n = 24/3; controlR+E n = 32/5, cKOR+E n = 31/5). For expanded mEPSC traces and mIPSC data, see Fig. S3.
All data are means ± SEM; * p ≤ 0.05, ** p ≤ 0.01, *** p ≤ 0.001 as determined by Student's t test (A-H, L-N) or two-way ANOVA in J (genotype: ***p < 0.001; [Ca2+]ex: ***p < 0.001, interaction: *p ≤ 0.05; p values of post-hoc Holm-Sidak tests are shown in J). For analyses of release components during trains, see Figs. S3A-D. All numerical data are in Table S5.

