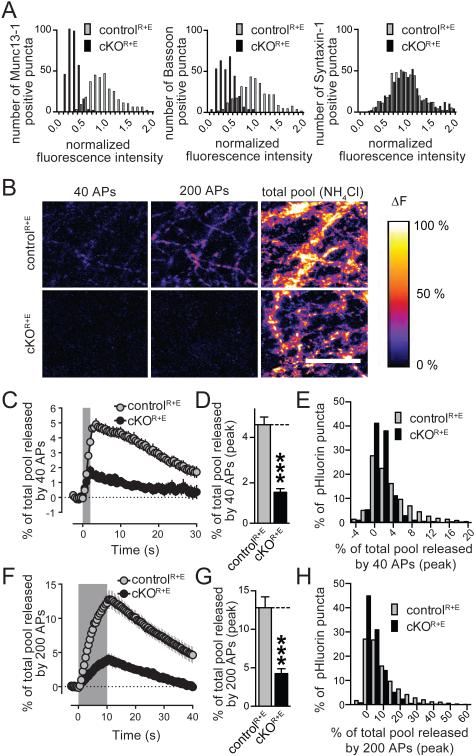
Figure 6. Uniform disruption of active zone composition and function in cKOR+E neurons.
A. Histograms of the distribution of fluorescence intensity levels in cKOR+E and controlR+E synapses (normalized to the average fluorescence in control). Data are from the experiments shown in Figs. 1B, C. For histograms of RIM, ELKS, Piccolo, RIM-BP2, Liprin-α3, and PSD-95 see Fig. S4C.
B. Pseudocolored images of SypHy expressing cultures stimulated with 40 and 200 action potentials (APs), and dequenched with NH4Cl. Images represent peak fluorescence change.
C-E. Quantification of fluorescence changes in cKOR+E and controlR+E neurons stimulated with 40 APs, including the time course of the mean fluorescence change in active synapses as a percentage of the fluorescence increase upon NH4Cl application (C), the peak response (D) of active synapses, and frequency distribution of the % response in active synapses at the end of the stimulus train (E; controlR+E n = 3493 NH4Cl responsive synapses/ 2486 active synapses/ 9 coverslips/3 independent cultures, cKOR+E n = 2192/1272/9/3, the number of coverslips is used as a basis for statistics).
F-H. Quantification as in C-D but for neurons stimulated with 200 APs (controlR+E n = 3493/2640/9/3, cKOR+E n = 2291/1405/9/3).
All data are means ± SEM; *p ≤ 0.05, **p ≤ 0.01, ***p ≤ 0.001 as determined by Student's t test. All numerical data are in Table S6.

