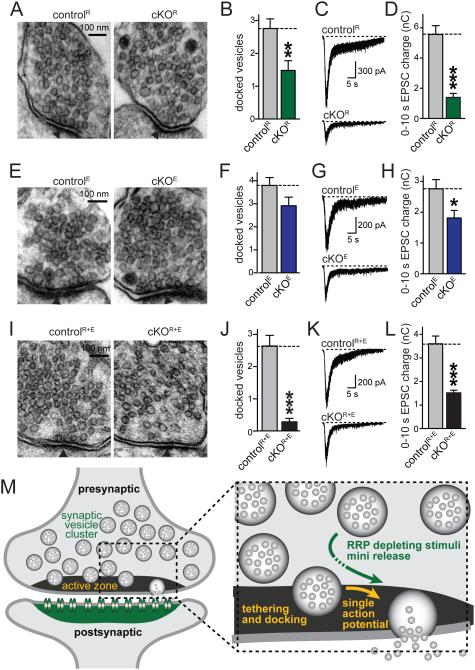
Figure 7. Persistence of a readily releasable pool upon loss of synaptic vesicle tethering and docking.
A-D. Sample images (A) and quantitative analyses of synaptic vesicle docking (B) in glutaraldehyde fixed neuronal cultures, and sample traces (C) and quantitation (D) of RRP of RIM deficient cKOR and corresponding controlR synapses. Focal application of hypertonic sucrose for 10 s was used to deplete the RRP (D).
E-H. Analyses as outlined in A-D, but of ELKS deficient cKOE and controlE synapses.
I-L. Analyses as outlined in A-D, but of RIM/ELKS deficient cKOR+E and controlR+E synapses.
For analyses of vesicle numbers, bouton size, PSD length, and vesicle distribution, see Figs. S5A-F. All data are means ± SEM; *p ≤ 0.05, **p ≤ 0.01, ***p ≤ 0.001 as determined by Student's t test (analysis of vesicle docking and tethering: controlR n = 25 synapses, cKOR n = 25; controlE n = 25, cKOE n = 25; controlR+E n = 25, cKOR+E n = 25; analysis of RRP: controlR n = 20 cells/3 independent cultures, cKOR n = 20/3; controlE n = 17/3, cKOE n = 17/3; controlR+E n = 20/3, cKOR+E n = 20/3). All numerical data are in Table S7.
M. Schematic of synaptic architecture and function upon disruption of the active zone. Structures and processes that are strongly disrupted upon RIM and ELKS deletion are labeled in yellow (active zone, docking, single action potential mediated release). Synaptic structures and functions that remain at least partially intact are labeled in green (the synaptic vesicle cluster, the postsynaptic density containing neurotransmitter receptors, mini release, and release in response RRP depleting stimuli such as action potential trains or hypertonic sucrose). Our experiments indicate that at least some vesicles can be recruited from vesicle pools distant from the presynaptic plasma membrane for release, and that these vesicles may be released immediately or undergo a transient docking state (dotted arrow) that is initiated after the onset of stimulation.

