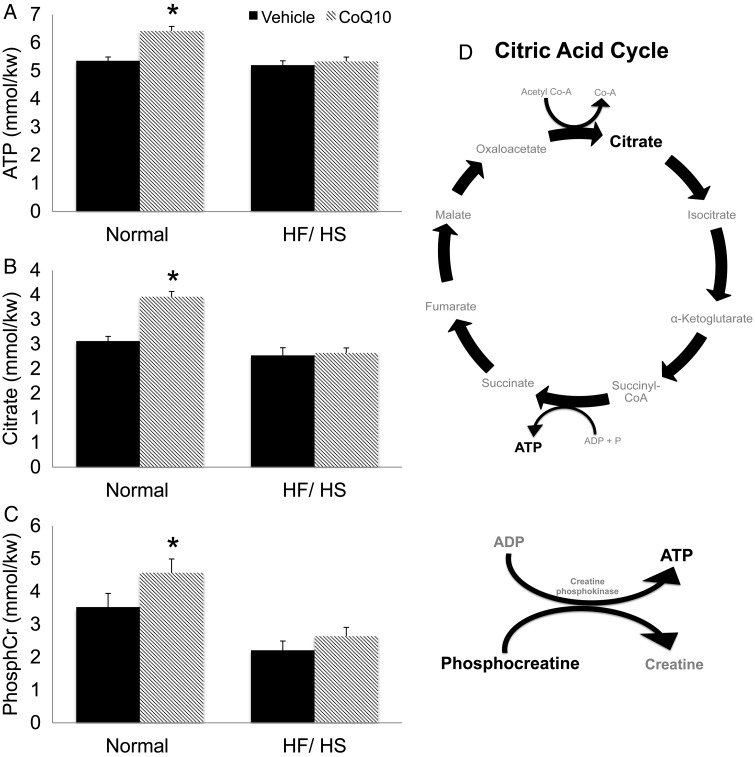
Figure 2.
Metabolites (A–C) were measured from single GV oocytes using microanalytical assays as described in the Materials and Methods section. Sixty oocytes from 5 mice per group were used to quantify levels of ATP, citrate and Creatine phosphate (PhosphCr). Mean metabolite levels are expressed as millimoles/kilograms wet weight (mmol/kg wet wt.). (D) Depiction of citric acid cycle and its metabolites. Statistical analyses were performed using Student's t-test or one-way ANOVA. *P< 0.05. Error bars indicate + SEM. HF/HS, high-fat/high-sugar; CoQ10, co-enzyme q10.

