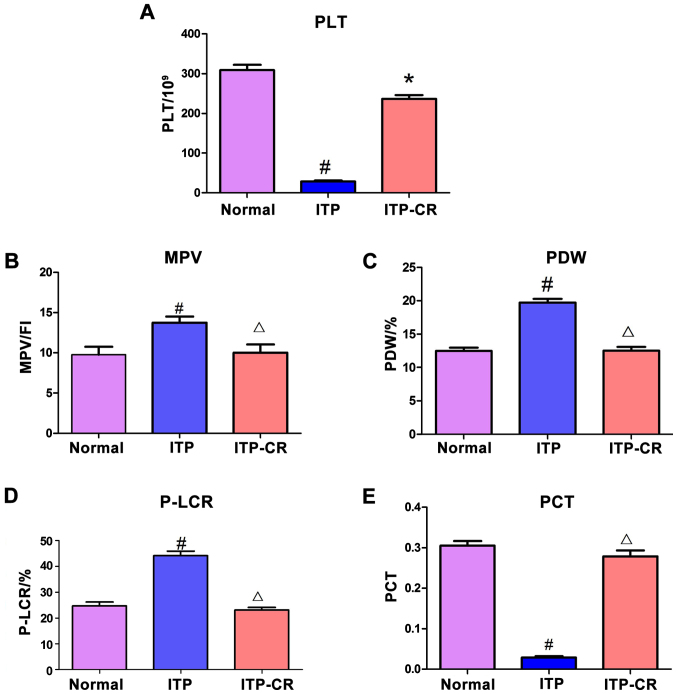
Figure 1.
Comparison of platelet parameters. (A) The expression of PLT in 3 groups, (B) the expression of MPV in 3 groups, (C) the expression of PDW in 3 groups, (D) the expression of P-LCR in 3 groups, and (E) the expression of PCT in 3 groups. #P<0.05, ITP-CR vs. normal control group; *P<0.05, in comparison to the normal control group; ΔP>0.05, in comparison to the normal control group. PLT, platelet count; MPV, mean platelet volume; PDW, platelet distribution width; P-LCR, platelet-large cell ratio; PCT, plateletcrit.

