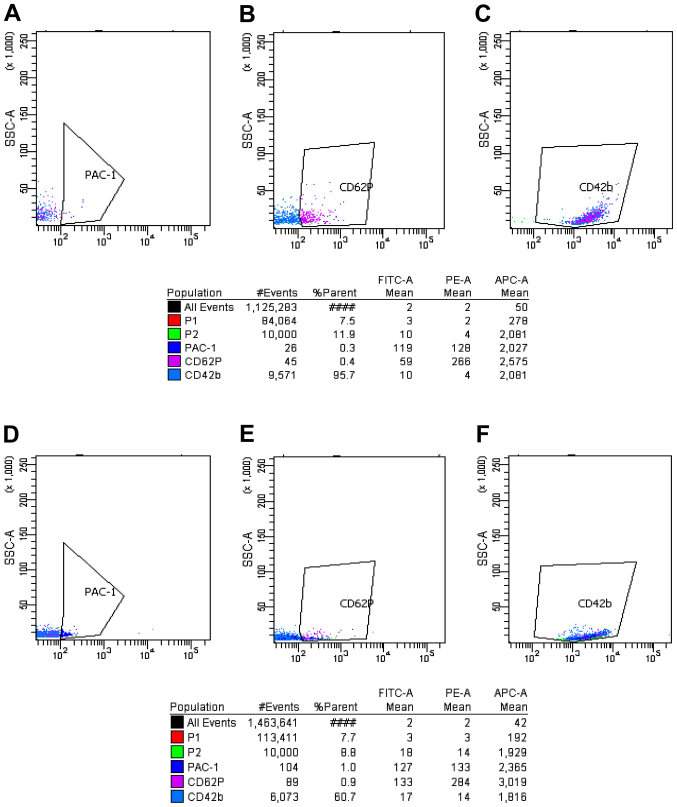
Figure 5.
Expression of PAC-1, CD62p and CD42b in the ITP group before and after platelet activation by ADP (FCM). P2 indicated 10,000 platelet obtained. The polygon in panels (A–C) shows the expression of PAC-1, CD62p and CD42b before platelet activation by ADP in the normal control group. The polygon in panels (D–F) shows the expression of PAC-1, CD62p and CD42b after platelet activation by ADP in the normal control group. FCM, flow cytometry; ITP immune thrombocytopenia.

