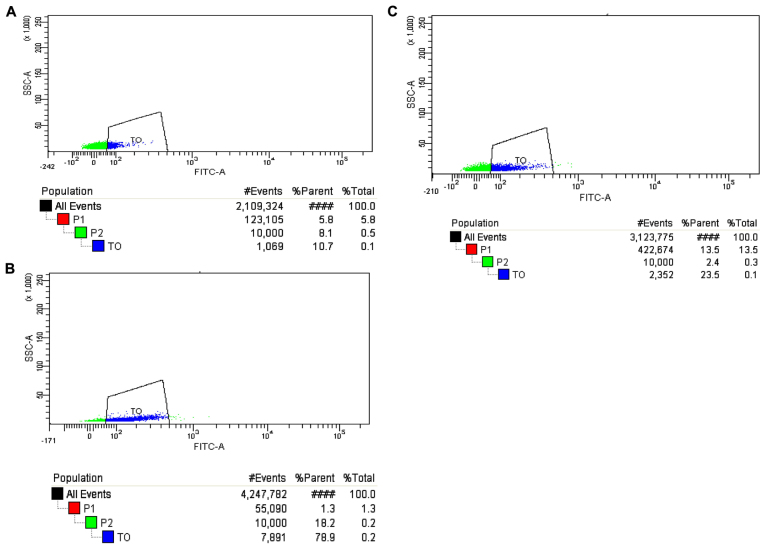
Figure 7.
Expression of IPF% in different stages of the ITP and normal control groups. TO represented reticulated platelets. (A) The polygon is the IPF% in the normal control group; (B) the polygon is the IPF% in the ITP group; (C) the polygon represented IPF% in the ITP-CR group. IPF, immature platelet fraction; ITP, immune thrombocytopenia; TO, thiazole orange.

