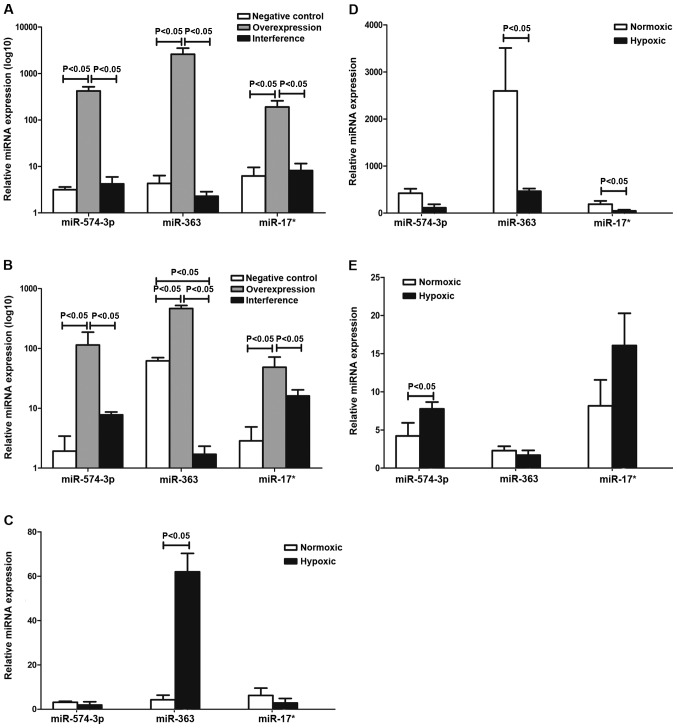
Figure 2.
Erythroid miRNA levels in the negative control, overexpression and interference groups. (A) Quantitative PCR results under normoxia in the three groups. Expression of miR-17*, miR-363 and miR-574-5p in the overexpression group was higher than that in the negative control and interference groups. Differences were statistically significant (P<0.05). (B) Quantitative PCR results under hypoxia in the three groups. The miR-17*, miR-363 and miR-574-5p expression level in the overexpression group was the highest. miR-363 expression in the interference group was less than that in the negative control group. miR-574-5p expression in the interference group was slightly higher than that in the negative group but significantly lower than that in the overexpression group. Differences were statistically significant (P<0.05). (C) miRNA expression in the negative control group under normoxia and hypoxia. miR-363 expression under hypoxia was higher compared to normoxia and the difference was statistically significant (P<0.05). (D) miRNA expression in the overexpression group under normoxia and hypoxia. miR-574-3p, miR-363 and miR-17* expression levels under hypoxia were lower than normoxia. Differences were statistically significant (P<0.05). (E) miRNA expression in the interference group under normoxia and hypoxia. miR-574-3p in hypoxia was higher than that in normoxia. Differences were statistically significant (P<0.05).

