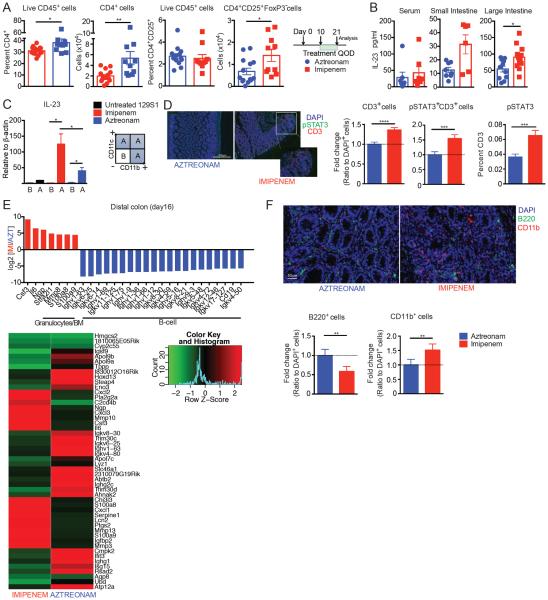
Fig. 3.
Treatment with imipenem-cilastatin in GVHD mice results in elevated numbers of donor CD4+ T cells, and increased production of IL-23 in the colon. (A to F) Lethally irradiated 129S1 recipients were transplanted with C57BL/6 T-cell depleted bone marrow cells with 1× 10⁶ C57BL/6 T cells. Recipients were treated with imipenem-cilastatin or aztreonam as described in Fig. 2. (A) Colonic lamina propria-infiltrating leukocytes from recipients were analyzed on day 21 by flow cytometry. Data are combined from two independent experiments. Values represent mean ± SEM (n = 10–14). *, P < 0.05; **, P < 0.01 by Mann-Whitney U test. (B) Concentration of IL-23 in serum, whole small intestine homogenate, and whole colon homogenate. Data are combined from two independent experiments. Values represent mean ± SEM (n = 10–12). *, P < 0.05 by Mann-Whitney U test. The individual plots in the graphs indicate individual animals sacrificed at the time of the analysis in A and B. (C) Lamina propria-infiltrating leukocytes from the colon on day 21 were enriched for CD11b and CD11c simultaneously using a mixture of magnetic beads; IL-23 transcripts were quantified by real time PCR. Data are representative of two independent experiments. Values represent mean ± SEM (n = 3). *, P < 0.05 by Mann-Whitney U test. (D) Immunofluorescence staining was used to quantify pSTAT3, CD3, and DAPI-positive cells in colonic tissue collected on day 21 (the white bar indicates 500 μm). (E) RNA sequencing analysis of the distal colon on day 16 after allo-HSCT. The top 50 regulated genes are shown in the heatmap panel. (F) Immunofluorescence staining was used to quantify CD11b, B220, and DAPI-positive cells in colonic tissue collected on day 21 (the white bar indicates 50 μm). Data are representative of two independent experiments. Values represent mean ± SEM (n = 7–8). **, P < 0.01; ***, P < 0.001; ****; P < 0.0001 in D and F by Mann-Whitney U test.

