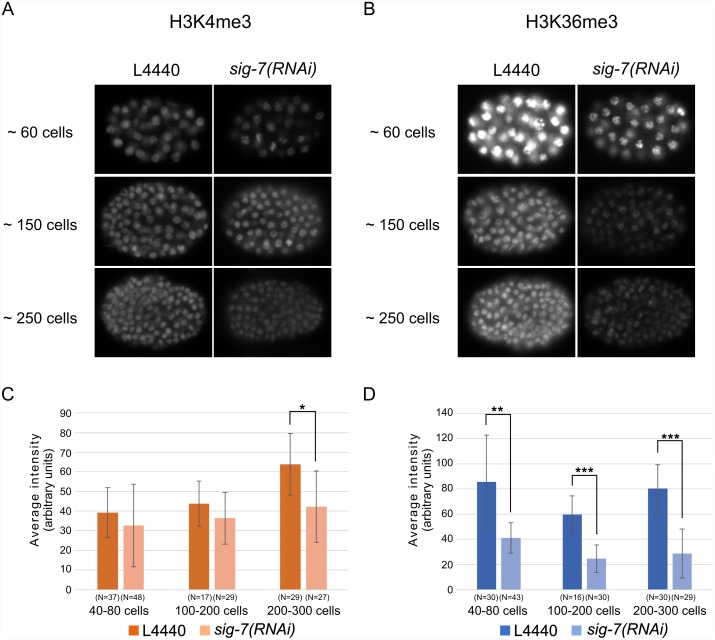
Fig 8. H3K36me3 is more significantly affected than H3K4me3 during embryonic development in sig-7(RNAi).
Anti-H3K4me3 (A) and anti-H3K36me3 (B) immunofluorescence patterns are shown for various embryonic stages. The significant difference is only observed in older embryonic stage between L4440 control and sig-7(RNAi). Quantification of the average intensity of H3K4me3(C) and H3K36me3(D) staining from various stages are shown. N = total number of embryos quantified. Error bars = S.D. The statistical significance of the difference in average intensity is indicated by asterisks (* = p ≤ 0.01, ** = p ≤ 10−5, *** = p ≤ 10−10).

