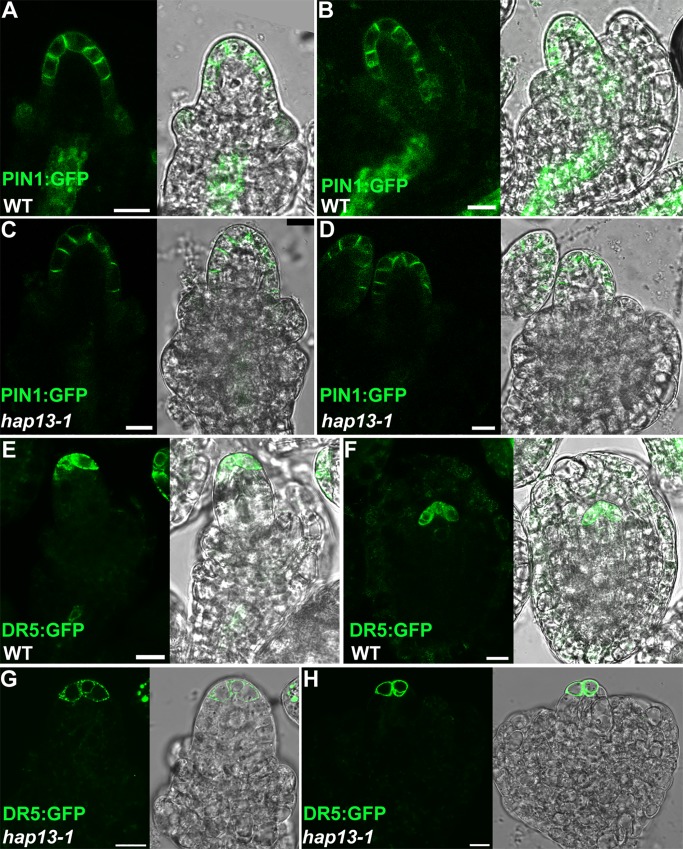
Fig 6. Auxin maximum and polar localization of PIN1 in hap13-1 ovules.
(A-D) PIN1::GFP in wild-type (A, B) or in hap13-1 (C, D) ovules at stage 2-II (A, C) or at stage 3-I (B, D) by CLSM. (E-H) DR5:GFP in wild-type (E, F) or in hap13-1 (G, H) ovules at stage 2-III (E, G) or at stage 3-II (F, H) by CLSM. Merges of bright-field and fluorescent images are placed at the right of corresponding fluorescent images. Bars = 10 μm.

