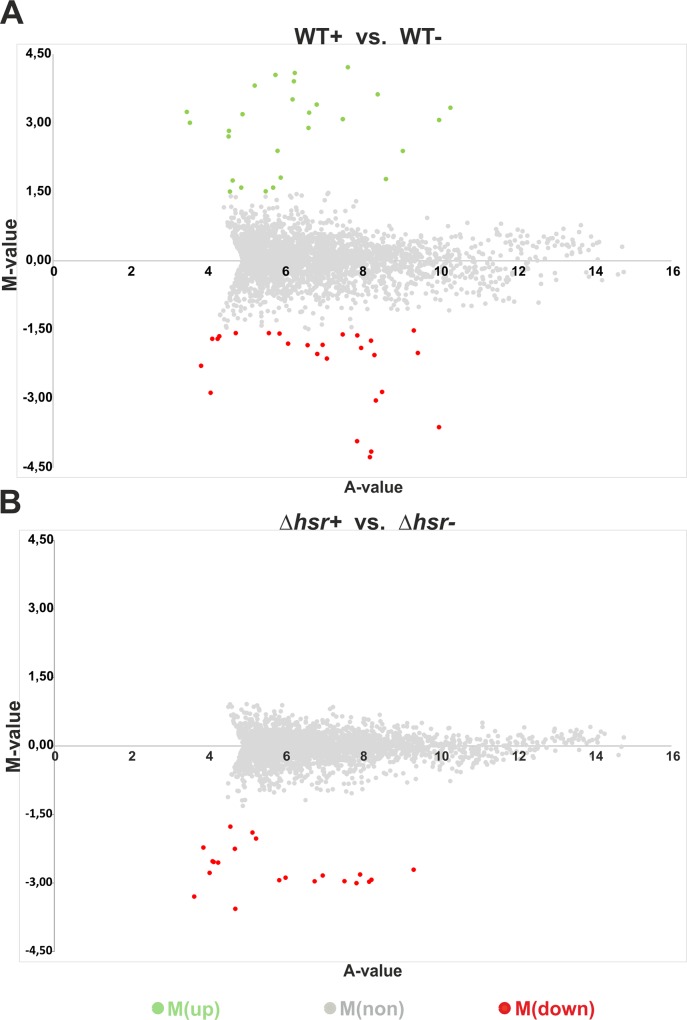
Fig 3. Identification of differential expression.
RNA-Seq datasets of stressed (WT+ or ∆hsr+) and non-stressed (WT- or ∆hsr-) S. coelicolor wild-type (A) and S. coelicolor ∆hsr (B) were used to generate plots, which show up-regulated [M > 1.5, green circles, M(up)], down-regulated [M < -1.5, red circles, M(down)] and non-regulated [M between +1.5 and -1.5, grey circles, M(non)] genes. M-values (Y-axis) and A-values (X-axis) were calculated as indicated in the Material and Methods section.

