
Figure 1. T1 and T2 weighted images of case 1 and 2 and normal control.
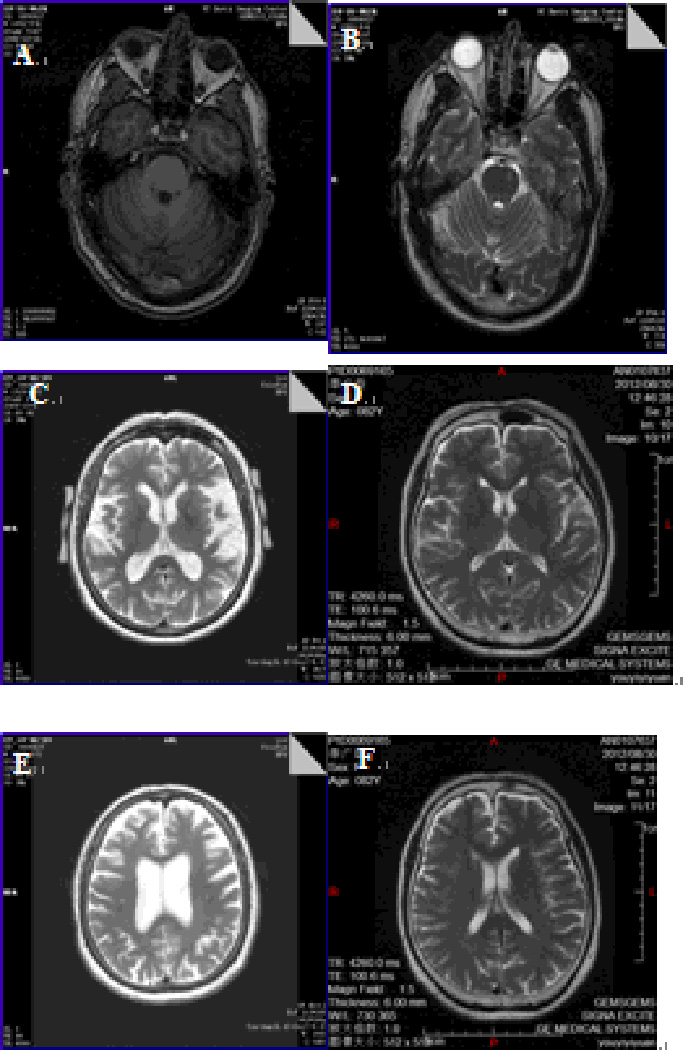
A) showing mild atrophy of the cerebellum in case 1.
B) showing increased signal intensity in the left of the pons in case 1.
C) showing atrophy of the temporal lobe in case 2.
D) showing normal T2 weighted images of normal control (female 83 years old).
E) showing atrophy of the frontal lobe and enlargement of the ventricules in case 2.
F) showing normal T2 weighted images of normal control (female 83 years old).