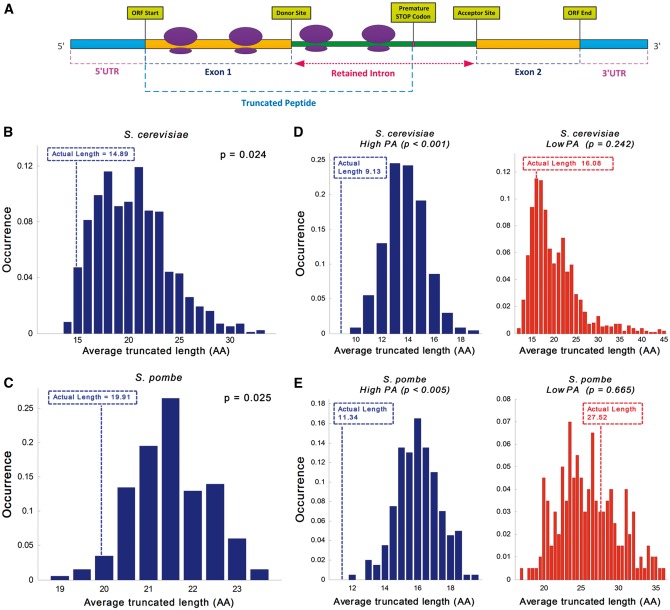
Figure 2.
First intronic STOP codon analysis. The position of the first STOP codon relatively to the beginning of the intron in the actual retained intronome tends to be closer to the 5′SS than in randomized intronome models. (A) Illustration of the translation process showing ribosomes on a transcript with a retained intron; the generated protein contains amino acids (AAs) that are encoded in the intronic nucleotide composition; as demonstrated in this case translation is usually terminated by a PTC, resulting in a truncated peptide. (B and C) Analysis of the average potential truncated peptide length distribution over the entire transcriptome (transcripts with introns) in the randomized models compared to the actual ones: (B) Average truncated peptide length distribution in S. cerevisiae suggests that there is preference for shorter retained protein length; the average length of the randomized model is 37% longer than the actual intronome (20.37AA vs. 14.89AA, respectively; empirical P = 0.024; see Materials and methods; actual length displayed in broken line). (C) Average truncated peptide length distribution in S. pombe suggests that there is preference for shorter retained protein length; the average length of the randomized model is 8% longer than the actual intronome (21.49AA vs. 19.91AA, respectively; empirical P = 0.025; actual length displayed by broken line); for comparison, the average truncated peptide length in the case of uniform nucleotide distribution is 21.33AA. (D and E) Average potential truncated peptide length over subsets of the actual transcriptome in comparison to the randomized models: (D) Intronome analysis of highly vs. lowly expressed genes in S. cerevisiae exhibits 76% longer truncated protein length in lowly expressed genes (9.13AA vs. 16.08AA; left and right, respectively); distribution analysis demonstrates evidence of selection in highly expressed genes but no significant selection in lowly expressed genes (empirical P < 1·10−3 and empirical P = 0.242; left and right, respectively; actual length displayed by broken line). (E) Intronome analysis of highly vs. lowly expressed genes in S. pombe exhibits 143% longer truncated protein length in lowly expressed genes (11.34AA vs. 27.52AA; left and right, respectively); distribution analysis demonstrates evidence of selection in highly expressed genes but no significant selection in lowly expressed genes (empirical P < 5·10−3 and empirical P = 0.665, respectively; actual length displayed by broken line).

