Figure 3.
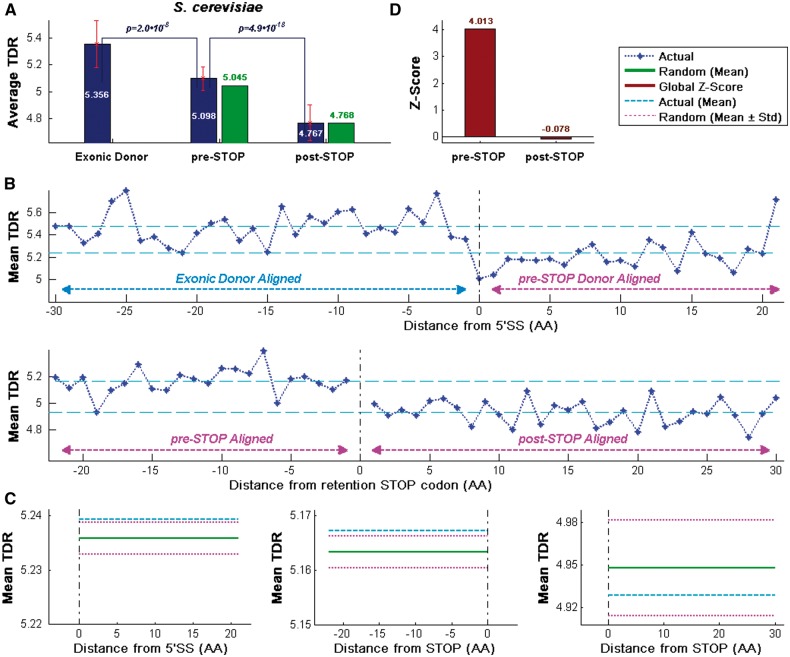
CUB profiles for the S. cerevisiae intronome. The profiles show that the average of TDRs index values upstream from the first intronic STOP codon is higher than the average of the TDR values downstream of it, supporting the conjecture that the beginnings of introns undergo evolutionary selection for higher TE. (A) Actual and random average TDR values (blue and green, respectively; see Materials and methods) aligned to the beginning of the 5′SS (Exonic Donor) and the first intronic STOP codon (pre-STOP, post-STOP) locations. (B) Mean TDR profile aligned to the beginning of the 5′SS (top) and the first Intronic STOP codon (bottom). As expected, TDR values downstream from the 5′ end of the exon/intron boundary (right side of the 5′SS) are lower than upstream of it (top; P = 2.04·10−8, Wilcoxon signed-rank test between the exonic and pre-STOP values, per gene). Mean TDR profile of the first Intronic STOP codon demonstrates that the TDR upstream from the first intronic STOP location is higher than the TDR downstream of it (bottom; P = 4.91·10−18, Wilcoxon signed-rank test between the pre-STOP and post-STOP values, per gene). (C) Mean values over all regions of the actual intronome and randomized version (blue and green, respectively). The STD of the randomized genomes for these regions (light magenta) shows a significant signal in the pre-STOP domain; mean values are 5.239/5.167/4.929 for the actual intronome and 5.236/5.163/4.948 for the randomized intronome (left, middle, and right; respectively). (D) High standard normalization global Z-scores (red, over all intronic ‘codons’; see Materials and methods) in the pre-STOP domain and very low global Z-scores in the post-STOP domain support the conjecture that the intronic pre-STOP codon selective pressure hypothesis is true; genes with STOP codons positioned in the downstream exon and locations with <15% of the intronome were ignored.

