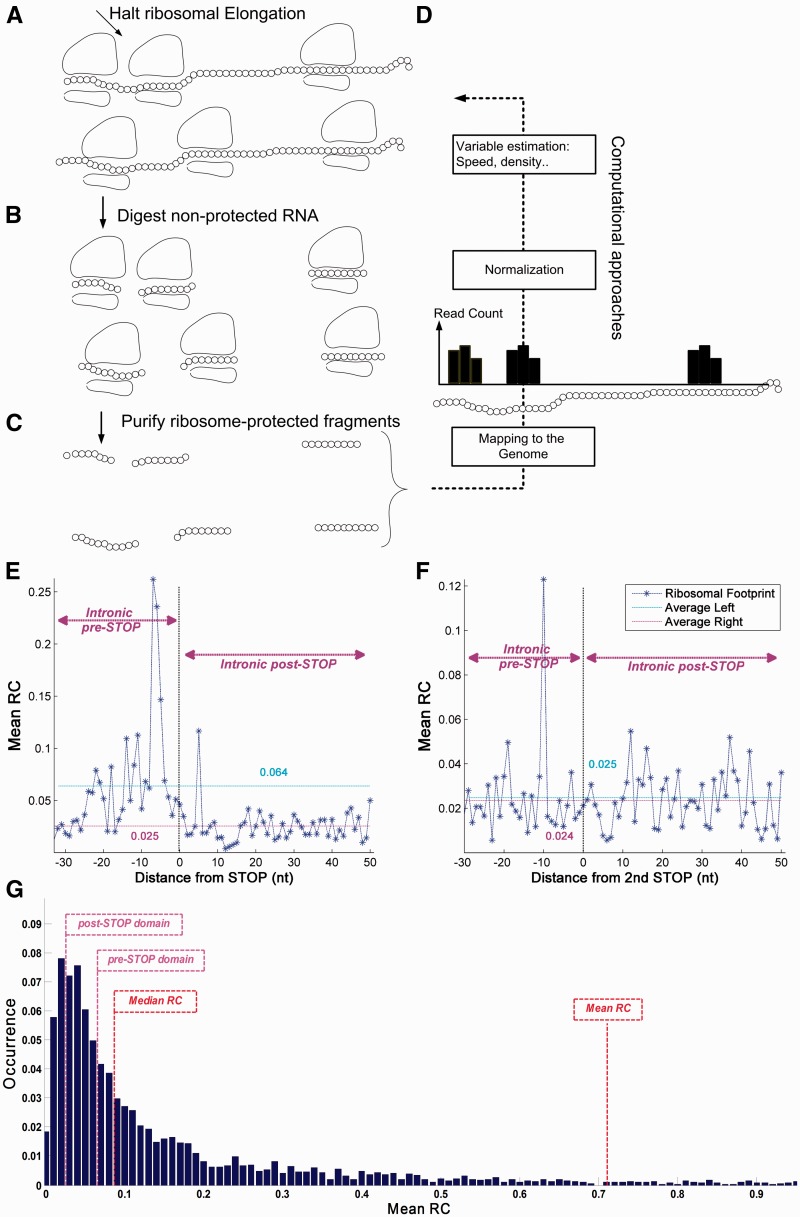
Figure 7.
RP analysis of S. cerevisiae. The RP method gives quantitative information of RD in a single nucleotide resolution. (A) Cells are treated (for example) with cycloheximide to arrest translating ribosomes; (B and C) RNA fragments protected from RNases by the ribosome are isolated and processed for Illumina high-throughput sequencing; (D) Based on the sequence reads, it is possible to computationally infer various biophysical properties related to the translation-elongation process. Ribosomal footprint RCs of a certain codon are generated when the codon is covered by ribosomes. Thus, highly translated genes tend to create a higher number of reads. (E) The mean RC values upstream from the first intronic STOP codon (pre-STOP side, left of the Termination Point) shows higher values compared with downstream mean RC values (post-STOP side, right of the Termination Point; 6.39 × 10⁻² before vs. 2.54 × 10⁻² after the first intronic STOP codon; P = 1.42 × 10⁻⁹, Wilcoxon signed-rank test). (F) The mean RC profile shows no significant difference between the intronic pre-STOP and post-STOP domains (2.47 × 10⁻² before vs. 2.35 × 10⁻² after second intronic STOP codon; P = 0.21, Wilcoxon signed-rank test); RC A-site offset is 15 nt. (G) RC distribution analysis of the S. cerevisiae genome demonstrates that as much as 40.8% of the yeast genes have lower mean RC values than introns in the pre-STOP domain, while merely 15.77% of the genes have lower mean RC values than introns in the post-STOP domain (see details in Materials and methods).

