Figure 3.
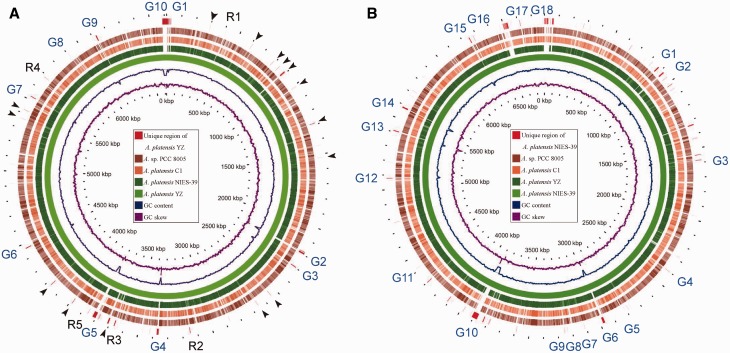
Comparative genomic analysis of four complete sequenced Arthrospira speices. A. platensis YZ (A) and A. platensis NIES-39 (B) were used as backbone (reference or hit) for the comparison to three query genomes, respectively. The genomes scaled to 100 kb. Counting from the outside toward the centre: red colour (slot 1) indicated that the nucleotide sequences were only detected in the reference genomes and undetermined gaps of the reference where query genomes were not mapped by ‘Ns’. Black arrow and R1-R5 in (A) indicate specific or unique regions in A. platensis YZ genome, and the regions R1-R5 were selected for analyses of gene gains in A. platensis YZ relative to other three genomes. G1-G10 in (A) and G1-G18 in (B) indicate 10 and 18 undetermined gaps in A. platensis YZ and A. platensis NIES-39 genome, respectively. Slots 2-5 showed that the corresponding query regions had higher sequence similarity (≥70%) with the reference sequence. Empty regions on the query slots indicated parts without similar hits between the backbone sequence and the query sequences, and those undetermined bases in the reference genomes. The last two circles respectively indicate the GC content and GC skew of the reference genomes. The Arthrospira sp. PCC 8005 was abbreviated as A. sp. PCC 8005 in this and the following figures.

