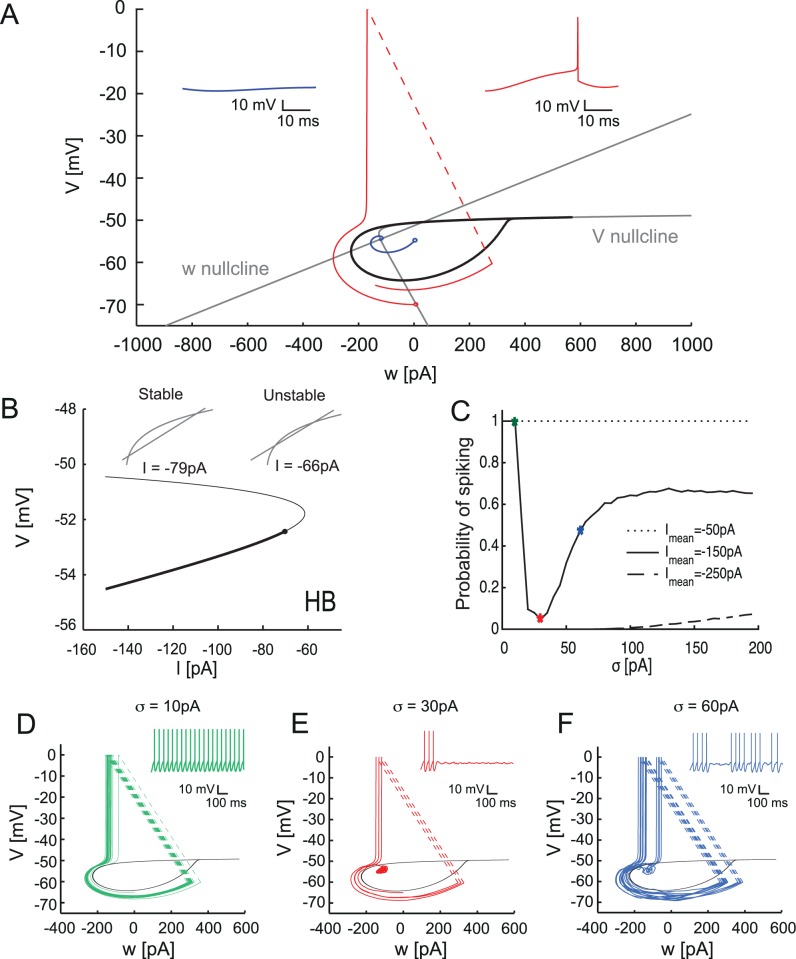
Fig 5. Bifurcation diagram and phase plane of the aEIF model.
A. Phase-plane of the model. Gray lines are the null-clines of the model. Drop-like set (black) corresponds to the basin of attraction of a stable fixed point. Red and blue trajectories correspond to rest and spiking respectively (inset). B. Bifurcation diagram of the aEIF model. Solid and thin lines represent stable and unstable fixed points for different values of I. Inset shows the intersection of the null-clines before and after the Andronov-Hopf bifurcation (HB) point. Point corresponds to HB. C. Probability of spiking during the stimulation by noise with various means (compare Fig 4B). D, E, F. Phase plane of the model with the corresponding trajectories and voltage traces (inset) when stimulated by Ornstein-Uhlenbeck noise for 1000 ms with mean I = −150 pA and noise amplitudes σ = 10 pA, 30 pA and 60 pA.

