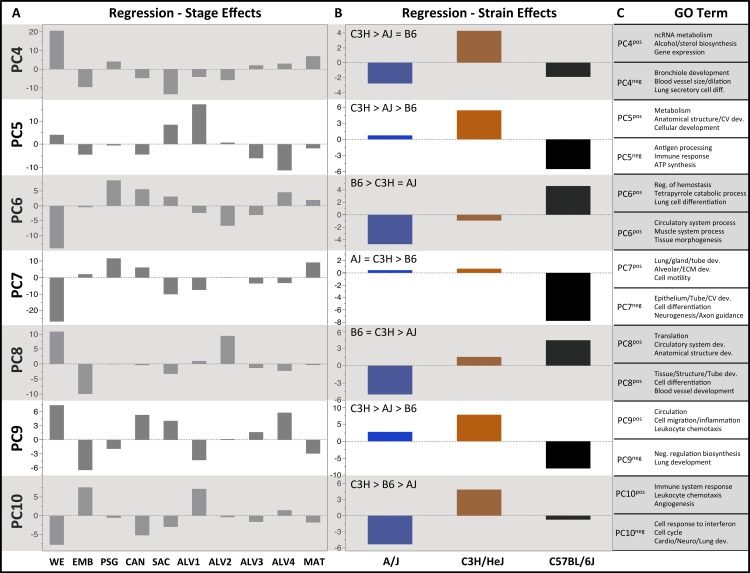
Figure 3. Regression modeling of gene expression as a function of strain and developmental stage.
Results of the linear regression analysis performed on PCA scores from strain-dependent principal components (PC 4–10). (A) Plots of least square means (y-axis) showing stage effects. (B) Plots of least square means (y-axis) illustrating strain effects. (C) Annotation enrichment results for characteristic gene sets with positive or negative loadings on PCs 4–10.

