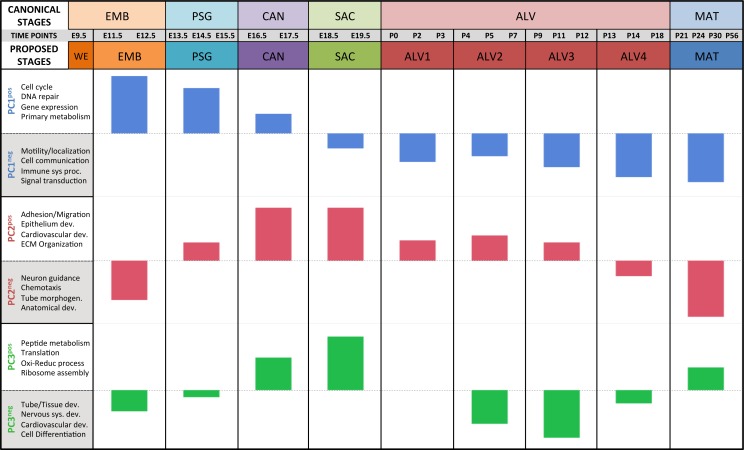
Figure 4. Regression analysis supports nine molecular stages of lung development.
Each set of colored bars represents the least square means of the stage effects for principal components 1–3. A summary of annotation enrichment categories are shown for the positive and negative characteristic gene sets from each component (complete results provided in Data S6).

