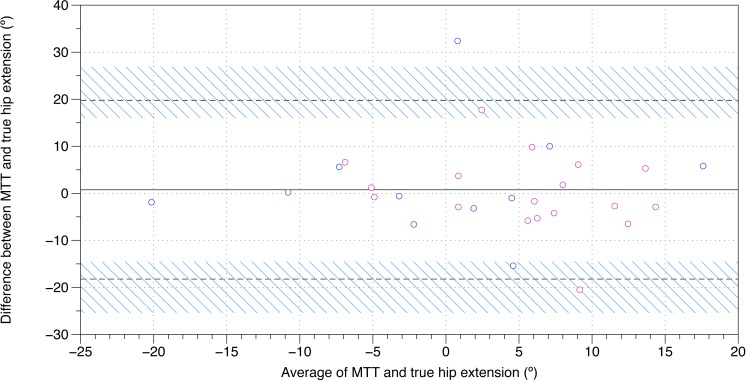
Figure 2. Bland–Altman plot of true hip extension and the modified Thomas test.
A mean difference of 0.7o, with 95% limits of agreements of −18.3o–19.7o, was found between the modified Thomas test and true hip extension. The black, solid line is indicative of the mean difference, whereas the black, dashed lines are indicative of the 95% limits of agreement. The blue, diagonal lines represent the 95% confidence intervals of the 95% limits of agreement. MTT, modified Thomas test; pink, female; blue, male.

