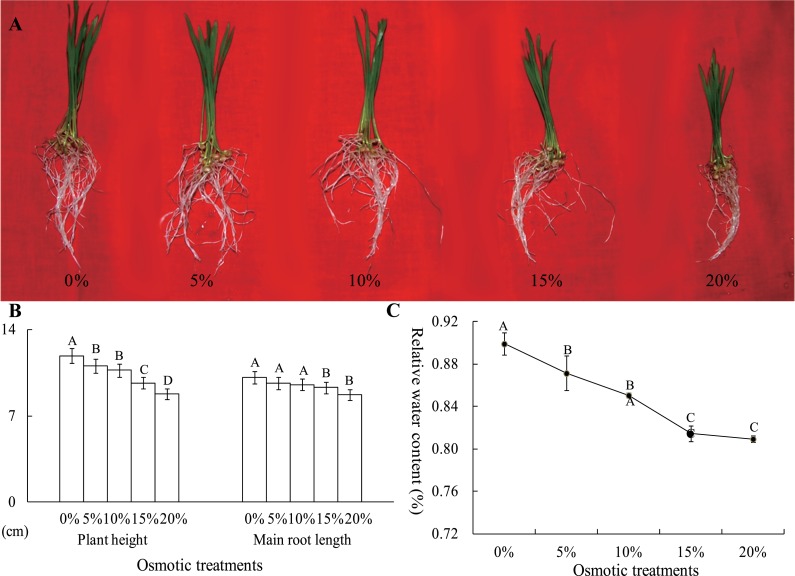
Figure 2. The plant height, main root length (B) and RWC of wheat seedling at the two-leaf stage, which were exposed to five osmotic stresses, were measured to assess the effects of osmotic.
The data was analyzed by one-way ANOVA analysis, and the LSD method was used for multiple comparisons. The significant difference is represented by capital letters at 0.01 level.

