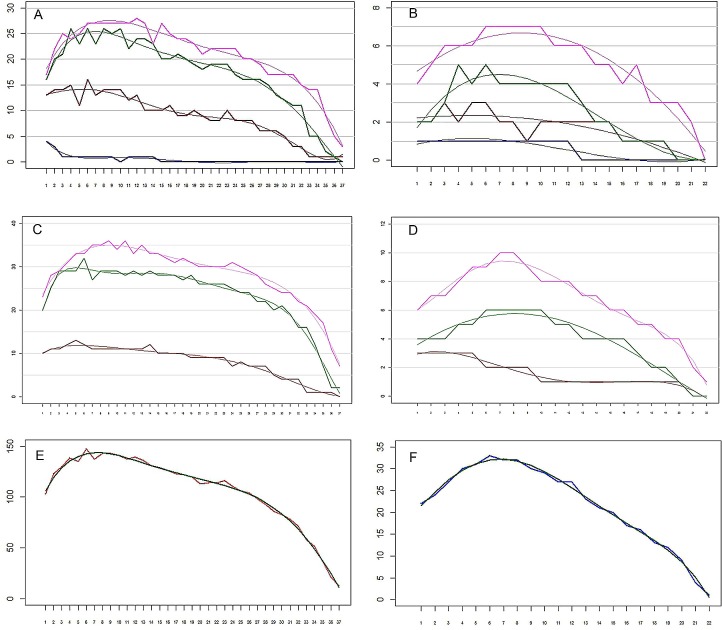
Figure 6. The remipede Speleonectes tulumensis.
(A) Specimen A, Endopod. Setation of four endopodal segments and corresponding regression trend lines. (B) Specimen F, Endopod. Setation of four endopodal segments and corresponding regression trend lines. (C) Specimen A, Exopod. Setation of three exopodal segments and corresponding regression trend lines. (D) Specimen F, Exopod. Setation of three exopodal segments and corresponding regression trend lines. (E) Specimen A. Setation of segments and the polynomial regression trend line with the best fitted coefficients. (F) Specimen F. Setation of segments and the polynomial regression trend line with the best fitted coefficients. Endopod: pink—distal segment (groups 19–20), green—mid distal segment (groups 15–18), brown—mid proximal segment (groups 11–14), blue—proximal segment (groups 9–10). Exopod: Pink—distal segment (groups 7–8), green—middle segment (groups 3–6), brown—proximal segment (groups 1–2). Abbreviations: young, specimen F; old, specimen A; real, observed; sum, total of all segments.

