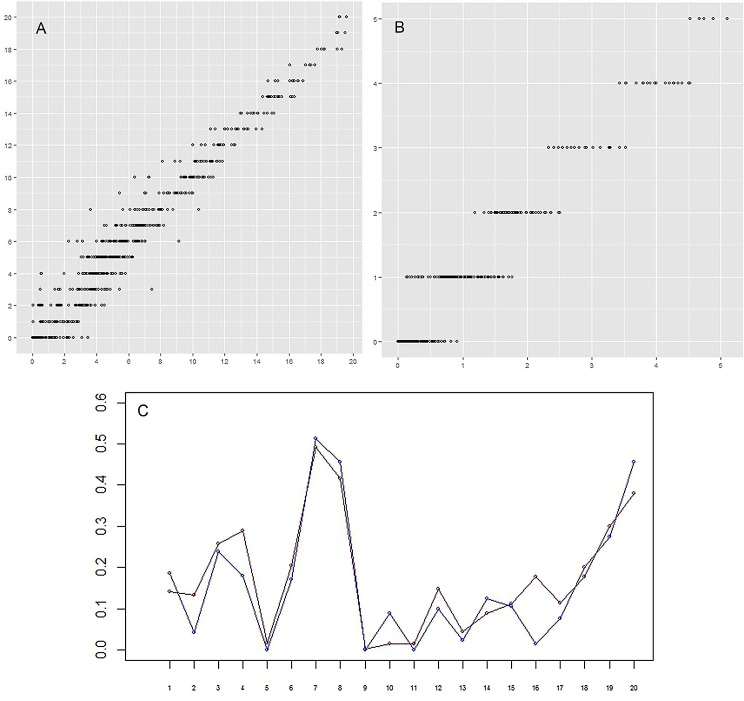
Figure 7. (A–B) Correlation between the actual number of setae and the predicted number.
For every group of setae and every limb (that is one point on plot) the real (vertical axis) and approximated (horizontal axis) number of setae are given. (A) (left)–specimen A; (B) (right)–specimen F. The correlation between real data and prediction is 0.98 and 0.97 for specimens A and F, respectively, p-value < 2.2e–16. (C) Setation vectors y = (yj) for groups. Red: specimen A; blue: specimen F. The correlation between two vectors is equal to 0.93. Horizontal axis: numerical idenficator j of the group. Vertical axis: the value of the setation vector component, yj.

