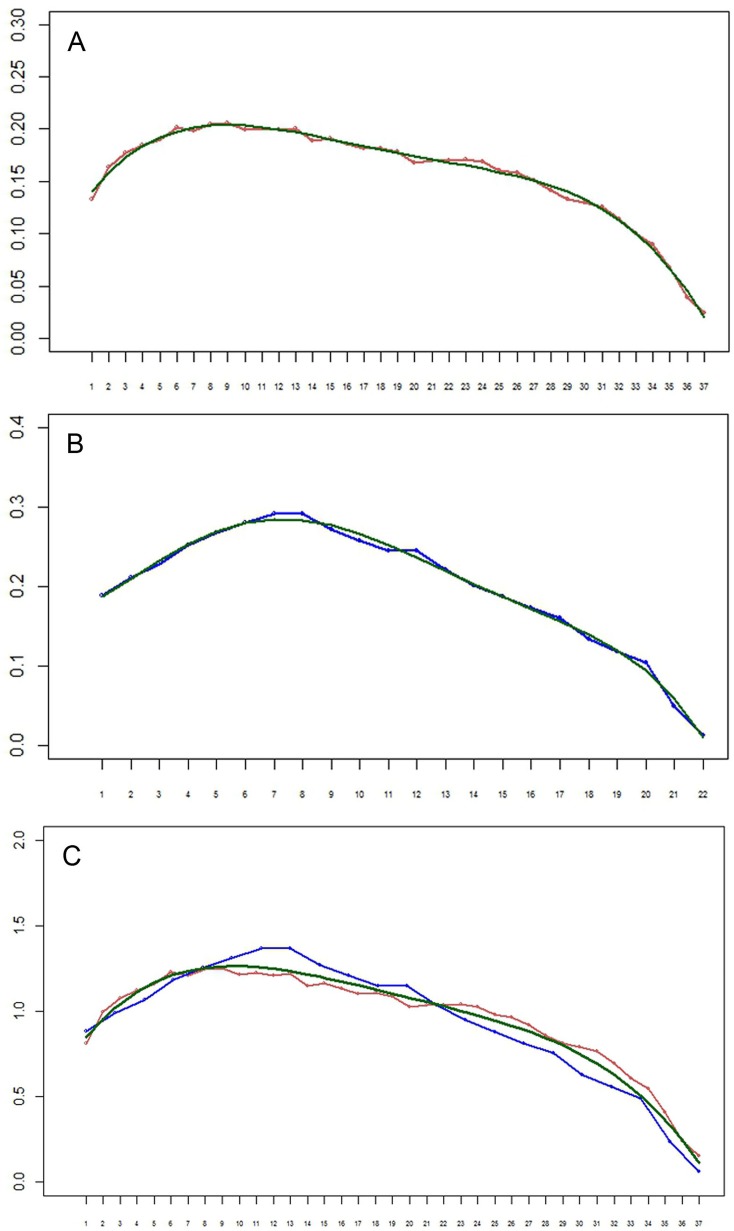
Figure 8. (A–B) Setation vectors x= (xi) for limbs of the remipede Speleonectes tulumensis.
(A) specimen A, (B) specimen F. The polynomial regression trendlines (0.158 − 0.212i − 0.163i2 − 0.004i3 − 0.059i4 for specimen A, and 0.2 − 0.271i − 0.217i2 + 0.04i3 − 0.028i4 − 0.029i5 for specimen F) are given in green. Horizontal axis: limb number i. Vertical axis: the value of the setation vector component, xi. (C) Setation vectors for limbs in one scale. Horizontal axis: limb number i. Vertical axis: the value of the setation vector component, xi. Coordinates of limbs in specimen F are stretched in such a manner that length of vector, in effect the number of limbs, for specimen F matches that of specimen A. Red, specimen A; blue, specimen F; green, the polynomial regression trend line (0.713 + 0.143i − 0.012i2).

