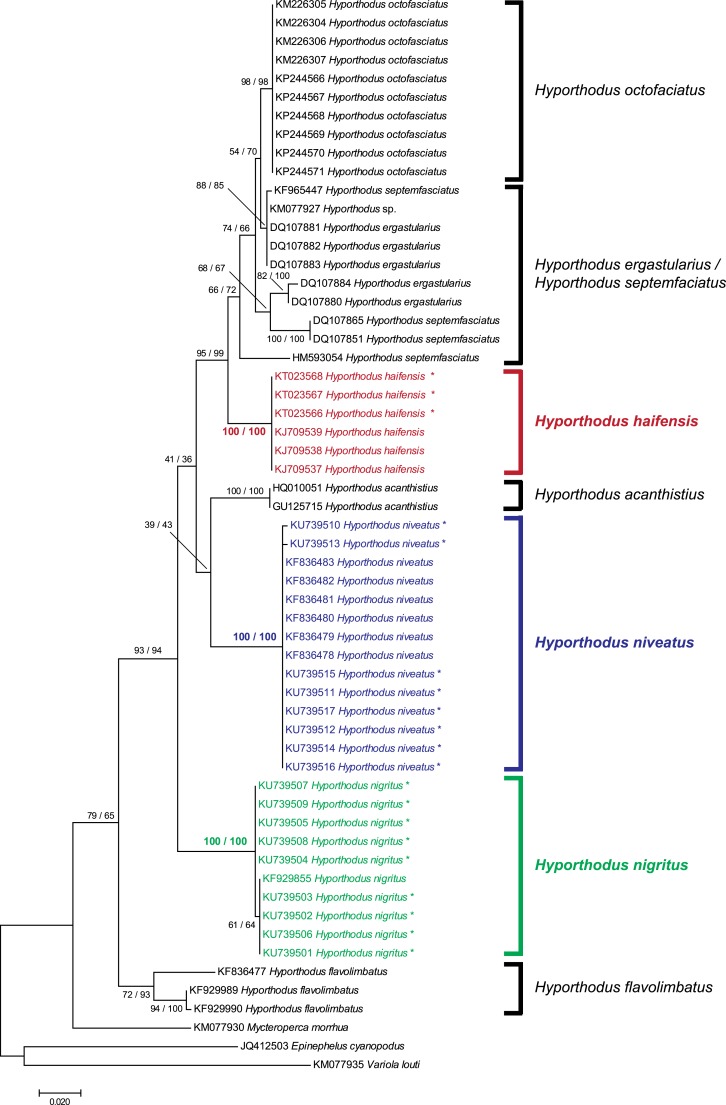
Figure 1. Tree of Hyporthodus spp. based on COI sequences.
The tree was constructed using the Maximum Likelihood method (100 replicates); a tree constructed using the Neighbour-Joining method (1,000 bootstrap replicates) showed the same topology except for some minor differences in the basal, non-Hyporthodus, branches; the NJ tree is shown. Support for major nodes is indicated for the two methods (as: ML/NJ). The scale bar indicates the number of substitutions per site (ML). The three species involved in our study, namely Hyporthodus haifensis, H. niveatus and H. nigritus, showed independent clades with 100/100 support. However, some higher nodes have low support.

