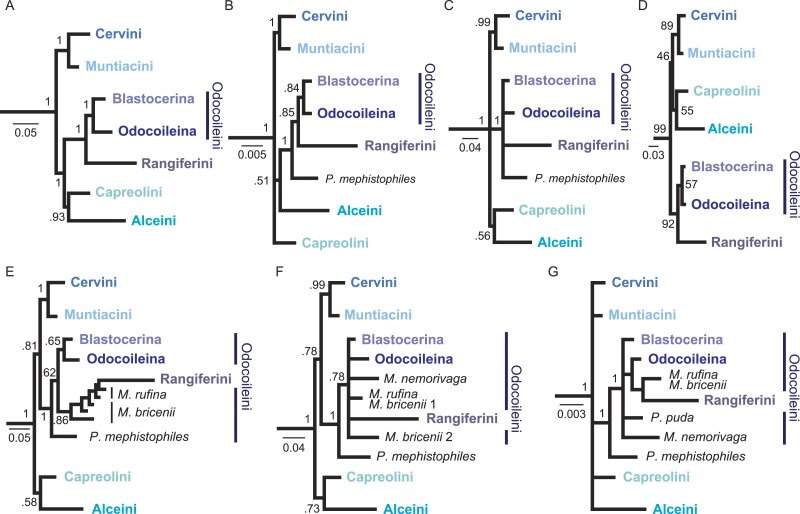
Figure 3. Overview of higher level topologies resulting from re-analysis of the complete mitochondrial genome sequences (Hassanin et al., 2012) and six different analyses of our data set.
(A) BI-mtG, (B) BI-1140-unpart, (C) BI-1140-part (D) ML-1140, (E) BI-747-unpart, (F) BI-747-part, (G) BI-569-unpart. Support values represent bootstrap values in D, all other support values are posterior probabilities. (A–D) show monophyly for all major cervid lineages, whereas in (E–G) resolution, particularly within Odocoileini is lost. Positioning P. mephistophiles proves to be difficult. Scale bars represent substitutions per site.

