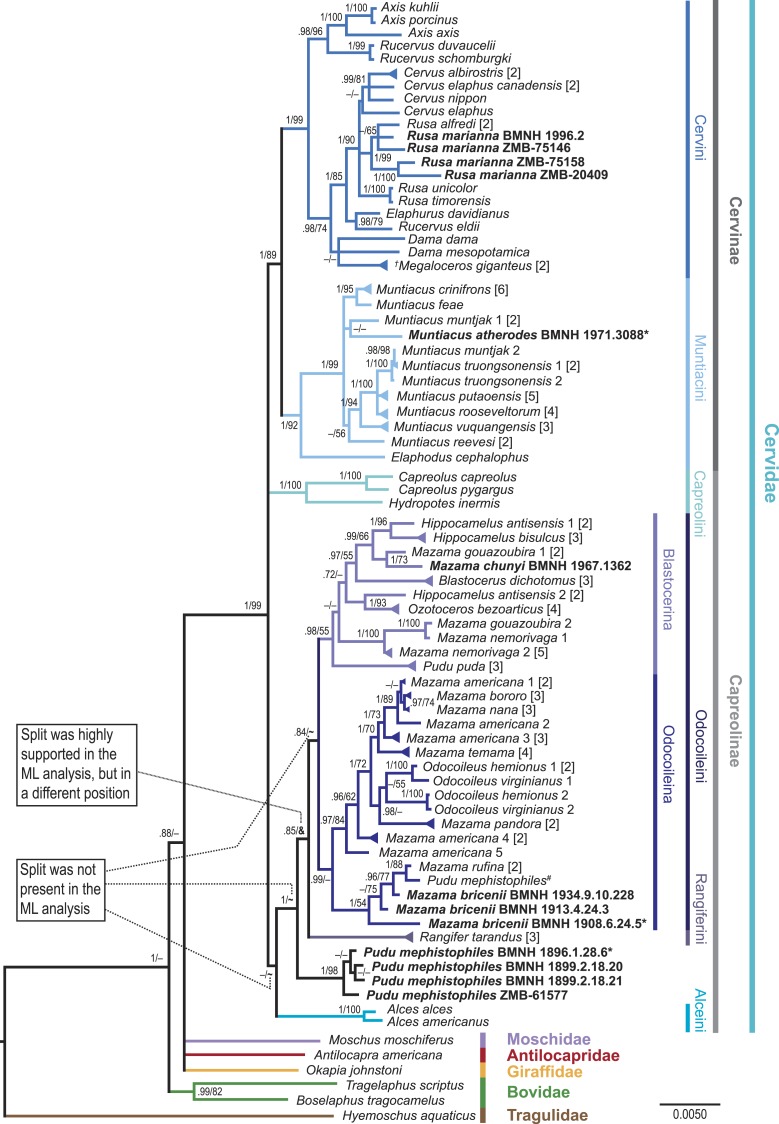
Figure 4. Consensus tree of the unpartitioned Bayesian Analyses (BI-1140-unpart).
Values represent posterior probabilities (PP), and if applicable, bootstrap (BS) support from the ML analysis is shown. Only values larger than 70% (PP) and 50% (BS) are displayed. If the support was not above 70% or 50%, but the split was present in one of the analyses; this is indicated by an “–”. “∼” indicates that the split was absent in the maximum likelihood analysis. “&” indicates that the split was absent in the maximum likelihood topology, but highly supported in a different position; this is only represented in the node separating Rangifer from the majority of Odocoileini (see Fig. S4). The numbers in square brackets indicate the number of individual sequences representing the taxon in the present analysis. If these multiple sequences representing one species were not identical, it is indicated by a triangular shaped tip of the branch. Taxa in bold are the newly sequenced specimens, asterisks indicate holotypes, and the hash indicates the putatively wrongly assigned P. mephistophiles sequence. Higher hierarchical taxa are shown on the right.

