
Fig. 2. Experimentally obtained thickness-dependent reflectivity spectra (transverse electric–polarized) for eGFP-filled microcavities.
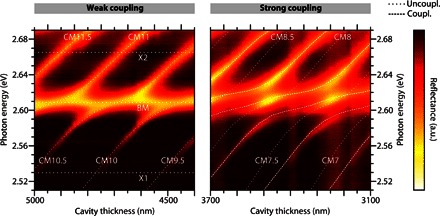
Dotted lines represent uncoupled photon (CMn, BM) and exciton modes (X1 and X2). Dashed lines represent eigenvalues of the coupled oscillator matrix obtained from coupled harmonic oscillator calculations. Associated coupling strengths, V1 = 97 meV and V2 = 46 meV. In the weak-coupling regime (left, high water content), modes cross, whereas strong exciton-photon interaction (right, low water content) shows anticrossing of the involved modes. a.u., arbitrary units.