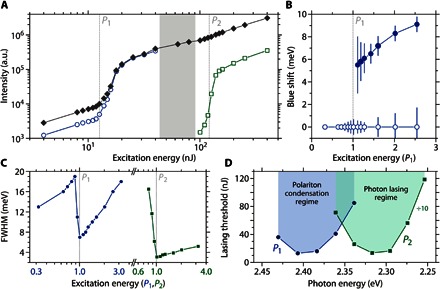
Fig. 4. Analysis of condensate and photon laser properties.

(A) Integrated microcavity emission intensity (filled diamonds), as well as individual contributions of LP2 (open circles) and CM5.5 mode (open squares) versus excitation energy. The two thresholds are attributed to the onset of polariton lasing (P1) and photon lasing (P2). (B) Spectral shift of the polariton condensate (closed symbols) and LP2 polariton branch (open symbols) as a function of the excitation energy (in units of P1). (C) Spectral width of the LP2 polariton emission (blue symbols) and the photon emission around CM5.5 (green symbols) as a function of excitation energy (in units of P1 and P2, respectively). FWHM, full width at half maximum. (D) Threshold energies of polariton lasing (P1) and photon lasing (P2) for different tuning of the cavity. Cavity tuning is achieved by scanning along the thickness gradient of the microcavity. P2 values were divided by 10 for clarity. Note the two distinct minima in threshold for the PC and photon lasing regime, respectively (2.40 and 2.31 eV).
