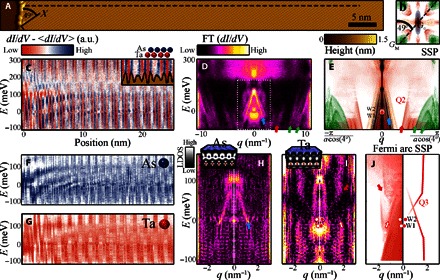
Fig. 2. Fermi arcs on Ta and trivial bands on As.

(A) Step edge topography oriented 49° with respect to the crystal axis. (B) Corresponding 49° cut (dashed line) across the SSP. (C) dI/dV map along the dashed line in (A) shows modulations in the density of states. Inset: Its commensuration with the topographic profile. It exhibits high density of states on As atoms and lower density of states on Ta, as well as dispersive interference patterns. (D) Fourier analysis of (C) shows the energy dispersion of the ellipse (blue arrow), the squares (green arrows), and the Fermi arcs (Q2 in Fig. 1E). (E) SSP cut along the dashed line in (B) identifies Q2 with inter–Fermi arc scattering, extending above and below the Weyl nodes’ energies (EW2 ≈ 2 meV and EW1 ≈ −13 meV, respectively). (F and G) Density of states on As sites (blue) and on Ta sites (red) reveals two different dispersing modes. (H) Fourier analysis of (F) detects the energy dispersion of the ellipse QPI. Inset: Calculated electronic local density of states (LDOS) of the ellipse band shows high localization on As sites. (I) Fourier analysis of (G) unveils QPI pattern associated with the Fermi arcs, which extrapolates to W2. Inset: Fermi arc wave function is localized on Ta sites. (J) Left: SSP of Fermi arcs only; right: dispersion extracted from left panel. Note its resemblance to (H). One of the modes extrapolates to the projection of W2 due to shrinkage of the Fermi arc (D, inset).
