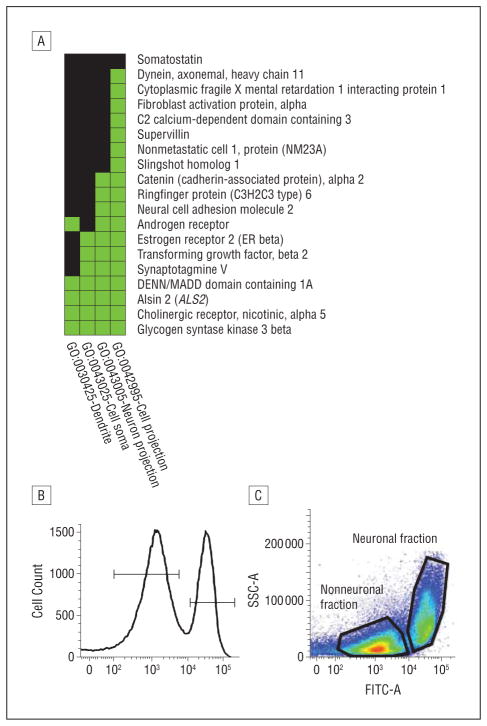
Figure 2.
Pathway analysis and fluorescence-assisted cell-sorting summary. A, Functional annotation chart of the neuronal plasticity cluster in the abused suicide completer group determined from the differentially methylated gene sets after false discovery rate correction. Shown are the genes and associated annotations for functional annotation cluster 4 related to neuronal plasticity. Green represents corresponding gene-term associations previously reported, and black represents corresponding gene-term associations not yet reported. B, Total nuclei stained with NeuN generated a bimodal fluorescence intensity distribution. The intensity of fluorescence in the nonneuronal fraction (left peak) is less than in the neuronal fraction (right peak). C, Density plot representing the neuronal and nonneuronal cell fractions as a function of the intensity of fluorescence (FITC-A). SSC-A indicates side scatter (internal granulosity).

