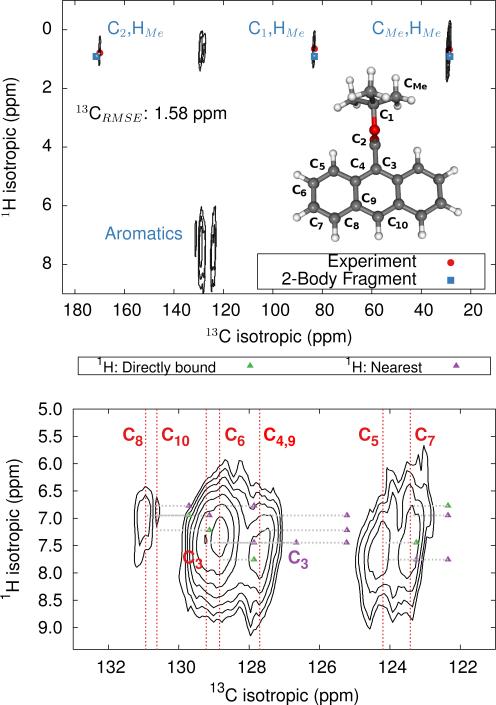
Fig. 7.
HETCOR 1H/13C spectrum for 9-TBAE (top) and zoom focusing on the aromatic region (bottom). The location of the experimental 13C peaks are given by red dashed lines. Predicted cross-peak locations are illustrated in green for protons directly bound to the carbon and in purple for the nearest neighboring proton.

