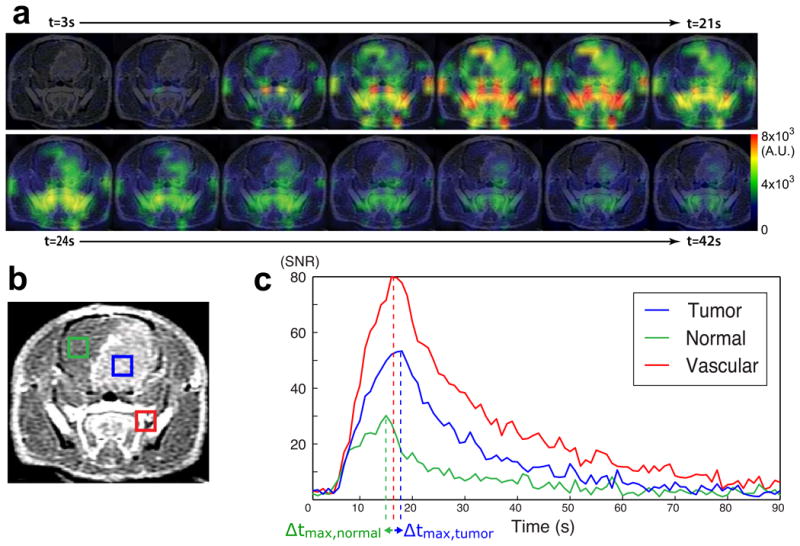
Figure 1.

Hyperpolarized HMCP data in a rat with orthotopic GBM. (a) The time course of HMCP signal change is shown in different regions of brain. (b) A representative axial T1 post-Gd image shows an enhancing lesion within the rat brain. The blue, green, and red voxels correspond to tumor, contra-lateral normal brain tissue, and blood vessel, respectively. (c) The plots of HMCP signal over time exhibit different perfusion characteristics for tumor, contra-lateral brain tissue, and blood vessel. Δtmax represents the time difference between peak tissue signal and peak vascular signal, for tumor and contra-lateral tissue.
