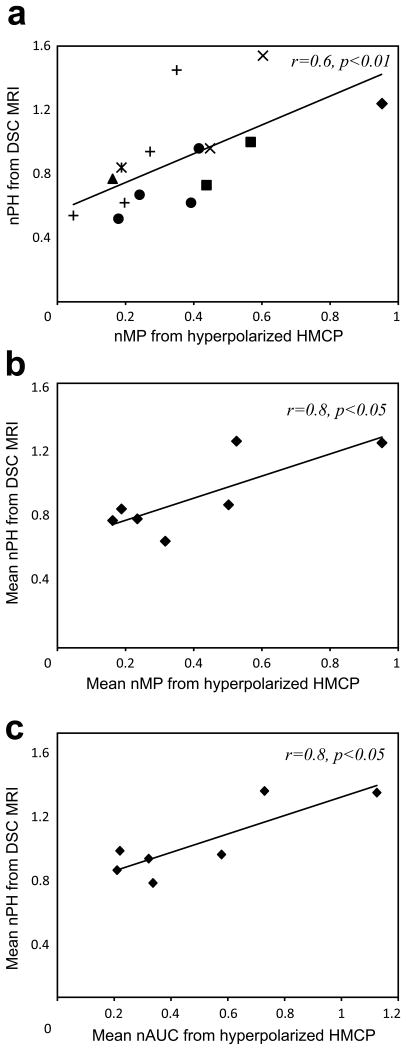
Figure 4.
Relationship between hyperpolarized 13C HMCP and Gd-enhanced DSC MRI data from tumor voxels. (a) A significant correlation (p<0.01) between the normalized maximum peak signal (nMP) from hyperpolarized HMCP data and the normalized peak height (nPH) from DSC data was observed in all 15 tumor voxels from 7 rats. Individual shapes represent data from the same animal. When mean values were calculated for each animal, nMP (b) and normalized area under the curve (nAUC) (c) from hyperpolarized HMCP data strongly correlated with nPH from DSC data for all 7 rats.

