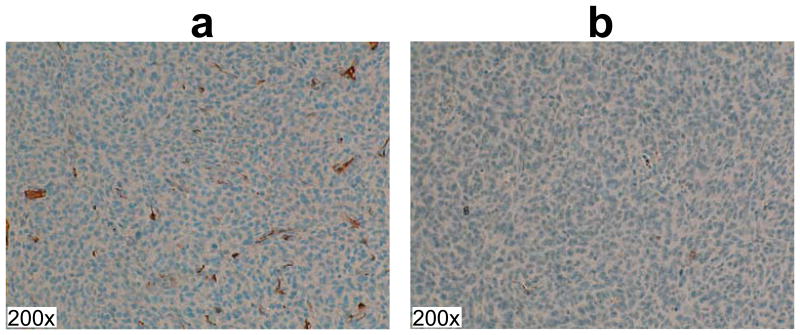
Figure 5.
Representative α smooth muscle actin slices for vascular staining. The red or dark brown regions represent stained smooth muscle cells in blood vessels. The animal with large amount of positive staining produced high perfusion values from hyperpolarized HMCP imaging (a, mean nMP=0.5, mean nAU=0.6), while the animal with small amount of positive staining produced small perfusion values hyperpolarized HMCP imaging (b, mean nMP=0.2, mean nAU=0.3). All images are at 200× magnification.

