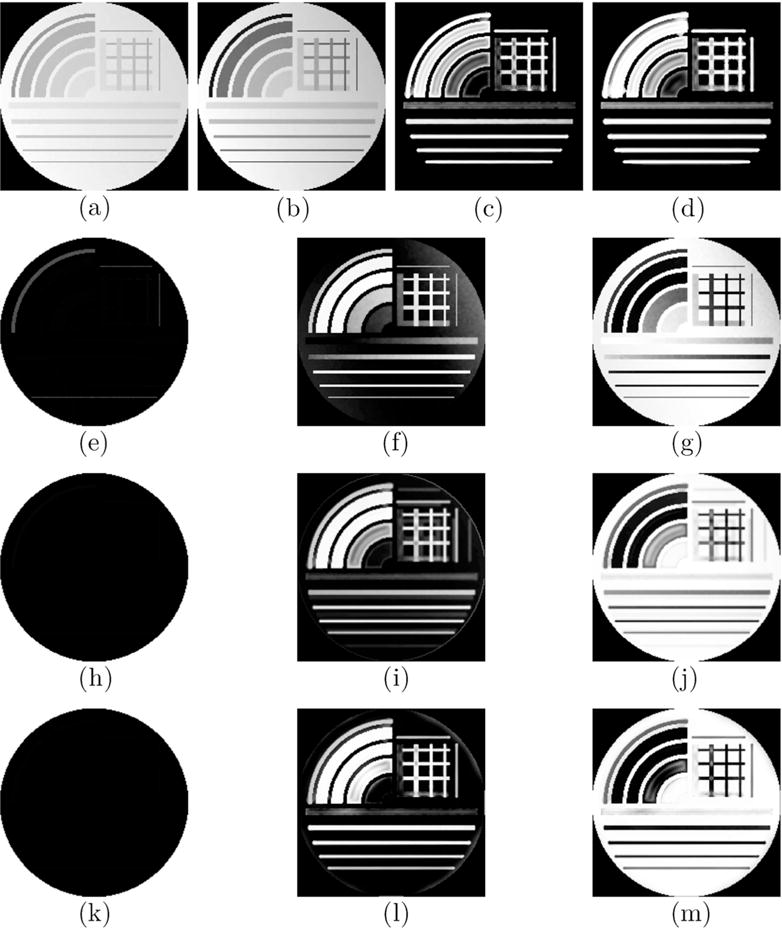
Figure 1.

The digital phantom (CNR = 140, Bias = 50%) with muscle and IMAT/IMCT like tissue generated at TE1 (a) and TE2 (b) simulating the input double echo UTE images. Straight line and curved segments of varying thickness were simulated to represent IMCT/IMAT tissue distribution in muscle. The structure tensor images derived from the double echo images are shown in (c) and (d). Row 2 shows the segmented clusters based on the Multichannel Fuzzy Cluster Mean algorithm: background (e), IMAT/IMCT cluster (f) and the muscle cluster (g). The effect of bias is clearly seen in the output field. The other two rows show the same clusters with the Adaptive Spatial Multichannel Fuzzy Cluster Mean (third row), and Adaptive Spatial Multichannel Fuzzy Cluster Mean with Bias shading correction (last row). The improvements in segmentation in rows 3 and 4 are clearly evident. It should be noted that the smallest arc (also widest) with 20% connective tissue was identified as ≈ 100% muscle since the structure was more blob-like than linear or planar.
