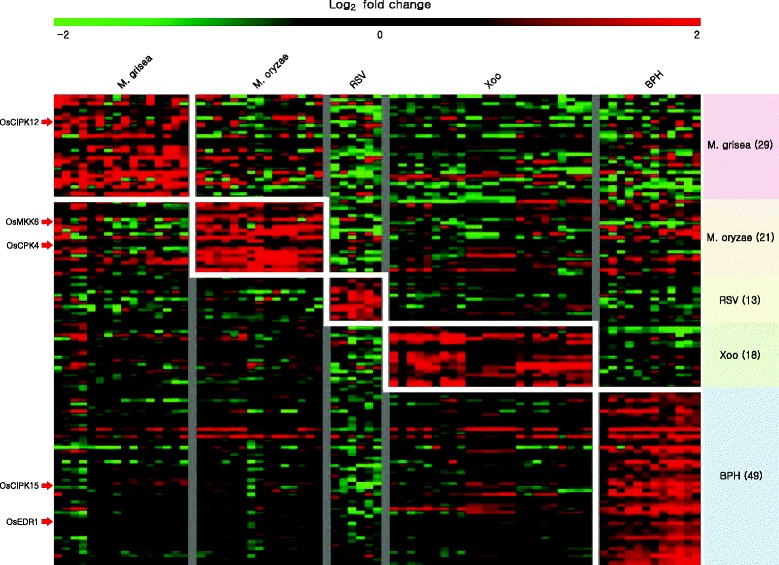
Fig. 2.

Heatmap analysis of expression patterns for kinase genes related to biotic-stress responses. Biotic stress responsive kinase genes heatmap is generated using log2-transformed fold change values under four stress conditions. Number of stress responsive genes in each condition is shown inside parenthesis after the applied biotic stress. Genes with red arrow pointing the heatmap are the known genes
