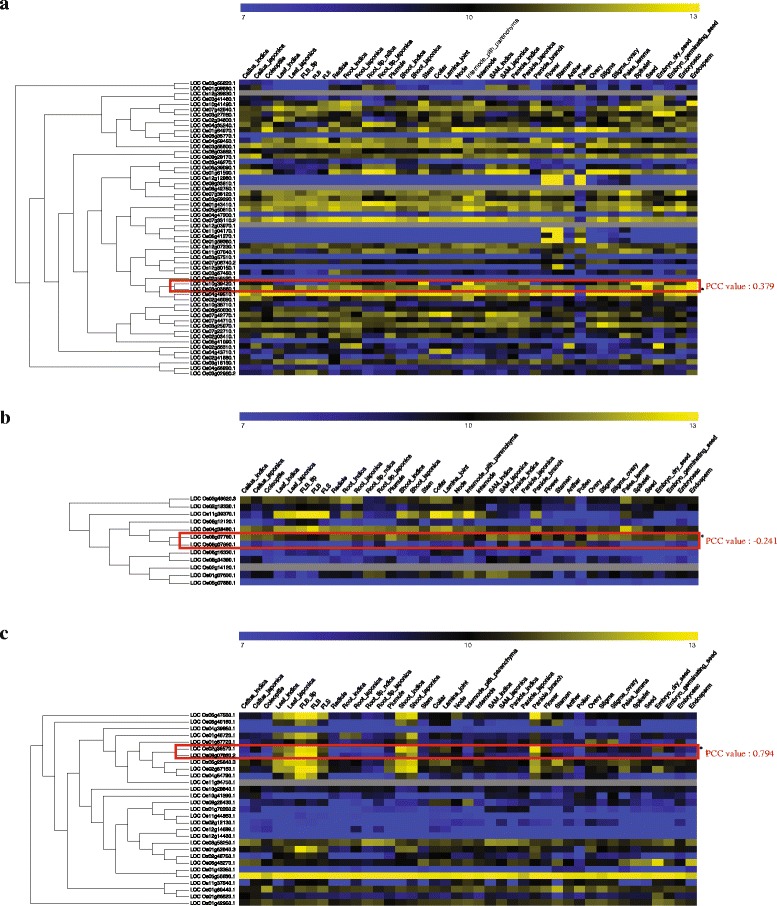
Fig. 6.

Phylogenomics data for three kinase subfamilies that include members with known functions. Integrating anatomical expression data within context of phylogenic tree suggested functional dominancy of OsCDPK1 (LOC_Os03g03660) with PCC value <0.379 (a), OsBAK1 (LOC_Os08g07760) with PC value of −0.241 (b), and functional redundancy of OsABC1-2 (LOC_Os02g36570) with PCC value of 0.794 = (c). Red boxes indicate pairs of kinases used for PCC analysis, gray color indicates the genes without probes in affymetrix array platform, and asterisks (*) indicate the selected kinases
