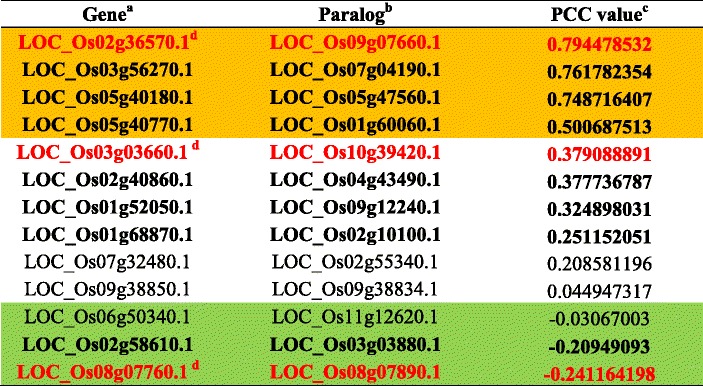
Table 2.
Rice kinase paralogs with known roles based on loss-of-function studies, and PCC values calculated for paralog pairings

aIndicates the rice kinase genes which have been functionally characterized and identified from OGRO database (http://qtaro.abr.affrc.go.jp/ogro/table)
bIndicates paralogs of rice kinase genes in gene column which are identified from RKD 2.0 databases
cIndicates Pierson correlation coefficient (PCC) value between paralog pairs in gene and paralog columns
dIndicates rice kinase genes (marked with red letters) used in Figure 6. Brown box has 0.5 > PCC value and is estimated to have redundant roles among paralogs; green one with negative PCC value and uncolored area with 0 < PCC value < 0.5 are estimated to have predominant roles among paralogs
