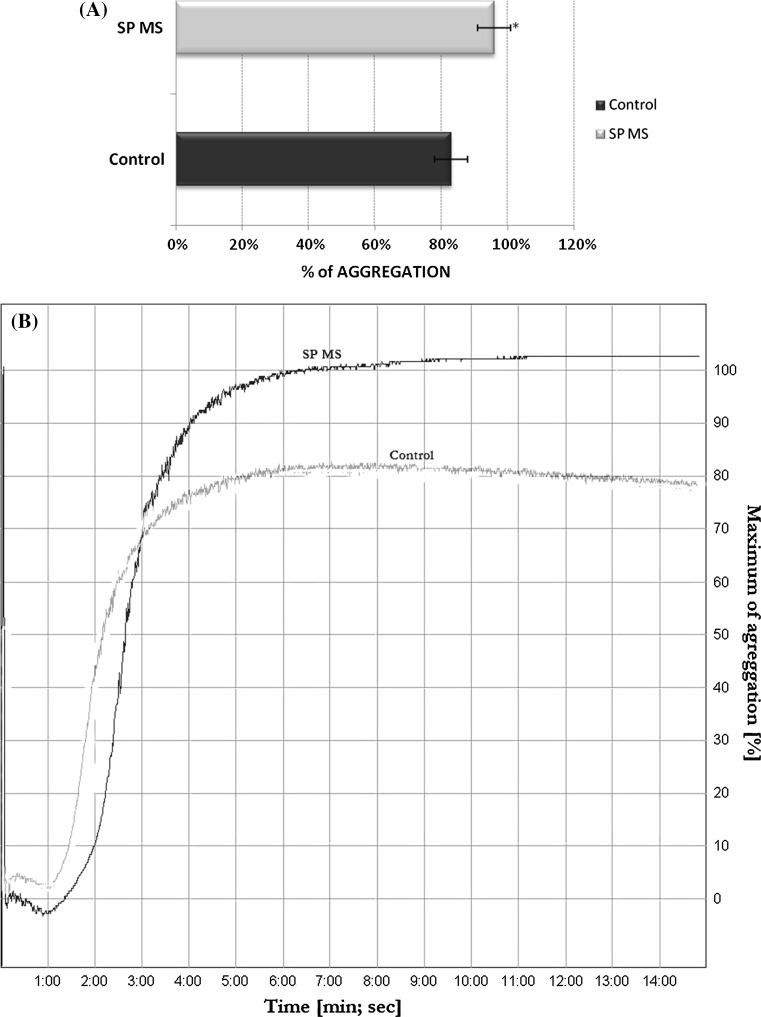
Fig. 1.
Blood platelet aggregation induced by arachidonic acid in platelet-rich plasma. Data represent mean ± SD, n = 50. Statistical analysis was performed using Mann–Whitney U-test *p < 0.0001 SP MS versus control (a). Typical curve of platelet aggregation in PRP after stimulation of platelets with AA (Chrono-Log aggregometer, Havertown, PA) (b)

