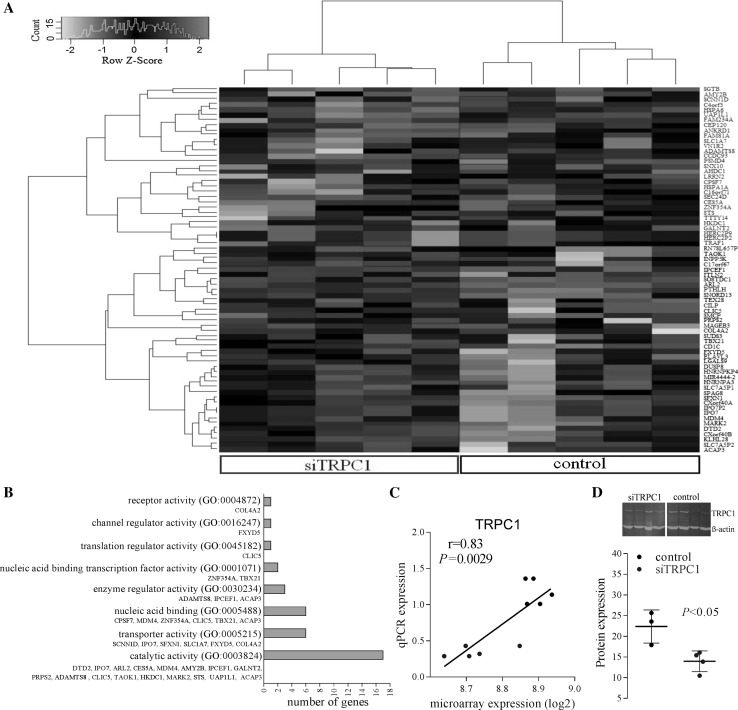
Fig. 1.
The results of differential gene expression analysis. a Heat map showing the clustering of samples by genes that significantly increased (red font) or decreased (green font) following TRPC1 silencing. 40 genes were up-regulated and 31 genes down-regulated significantly in TRPC1-silenced (siTRPC1) cells compared to control cells. Red and green colours represent relative high and low log2 gene expression values, respectively. b Molecular functions of differently expressed genes. c Correlation of TRPC1 expression data obtained from microarray and quantitative real-time RT-PCR (siTRPC1 = blue, Pearson correlation, n = 10). d Effects of silencing on TRPC1 protein levels measured by Western blot following 72-h vector incubation (n = 4). (Color figure online)

