Fig. 3.
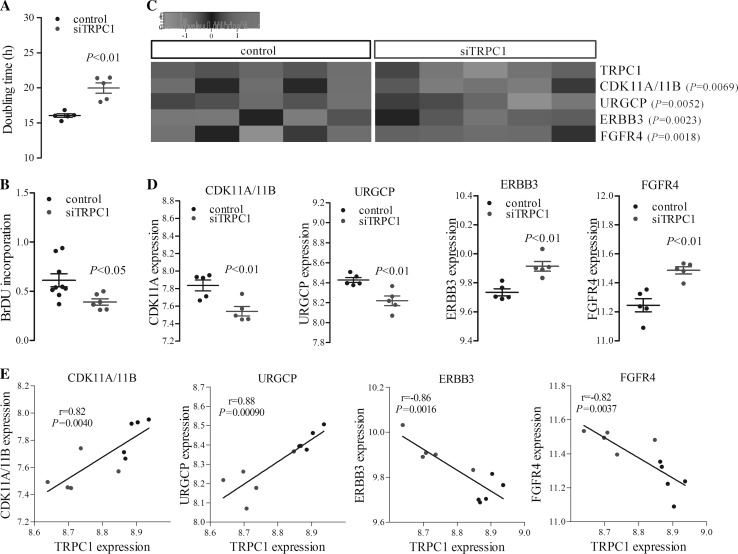
Changes in cell proliferation- and proliferation-related genes’ expression with that of TRPC1 following silencing in Huh7 cells. a The cumulative data of doubling time (in hour) in control and TRPC1-silenced (siTRPC1) cells (n = 5). Real-time changes in cell proliferation were evaluated and doubling time was calculated. b The cumulative data of cell proliferation measured by BrDU incorporation in control and TRPC1-silenced (siTRPC1) cells (n = 6). c Heat map showing the expression of the proliferation-related genes (CDK11A/11B, URGCP, ERBB3, and FGFR4) correlated with TRPC1 levels. Red and green colours represent relative high and low log2 gene expression values, respectively. d Changes in CDK11A/11B, URGCP, ERBB3, and FGFR4 expression in control and TRPC1-silenced cells (n = 5). e Correlation of proliferation-related genes with TRPC1 expression (siTRPC1 = blue, Pearson correlation, n = 10). (Color figure online)

