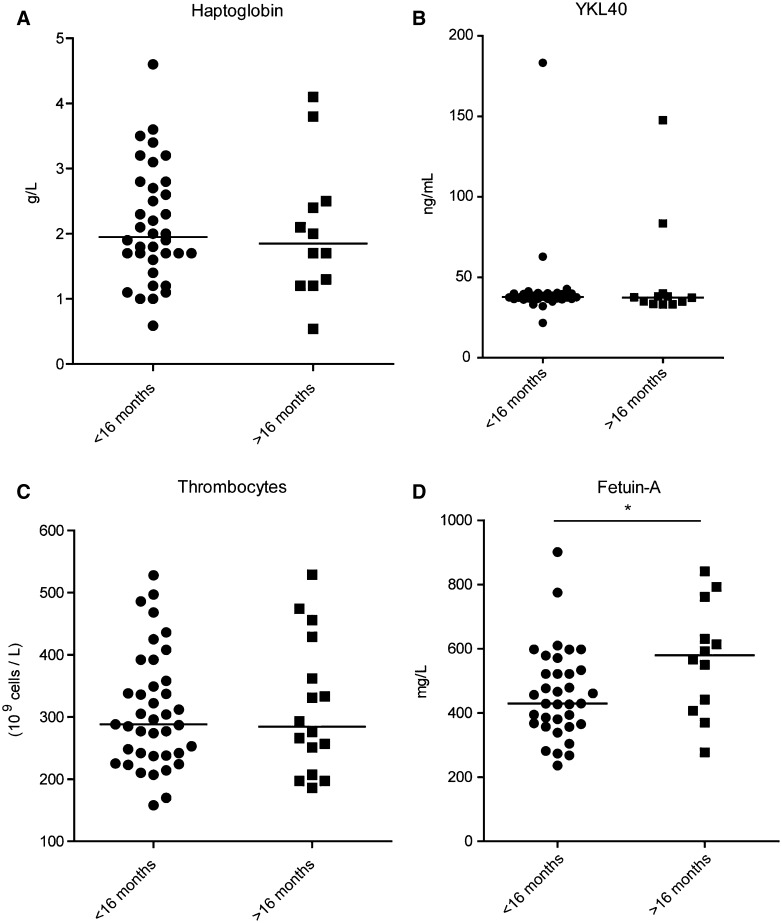
Fig. 4.
Analysis of candidate biomarkers and correlation of candidate biomarkers with treatment response. Protein concentrations of previously published candidate biomarkers were measured in serum samples by ELISA (a, d) or immunonefolometry. b Thrombocyte counts were measured by a CD4000 impedance hematology analyzer. c Correlation with treatment response was determined by Cox regression (not shown) and group comparison. Fetuin-a protein concentrations were significantly different between good and poor response groups (p = 0.03)

