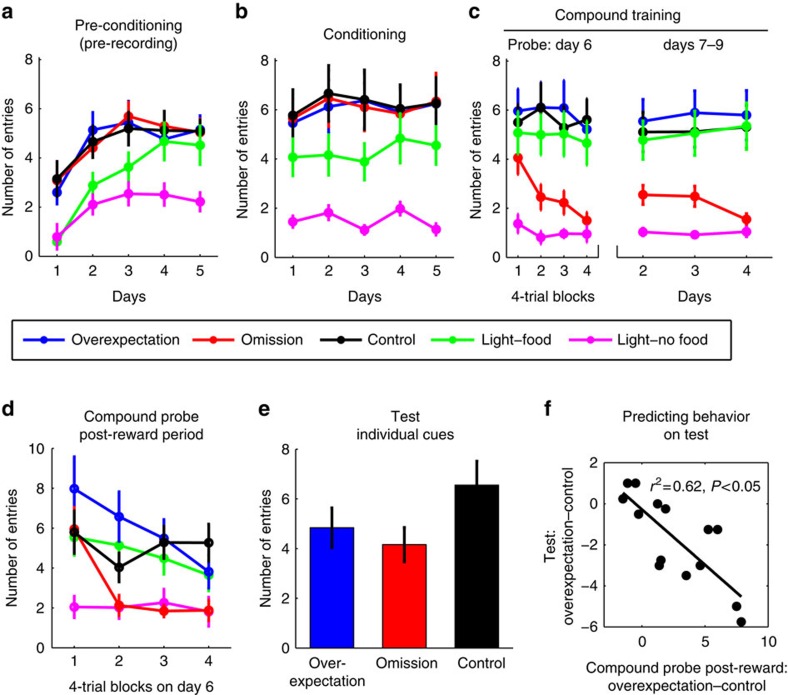
Figure 2. Behavioural data.
(a) Pre-Conditioning. A two-way repeated measures analysis of variance (ANOVA) found a main effect of cue (F(4,32)=12.2, P<0.05), an effect of session (F(4,32)=6.95, P<0.05) and an interaction (F(16,128)=1.8, P<0.05). Post hoc testing revealed no differences in responding among the auditory cues across days (all q<1, P>0.55), no difference between the visual cues on days 1–3 (max q=2.3, P>0.05) but a difference on the last 2 days (days 4 and 5, min q=7.9, P<0.05). (b) Conditioning. A two-way repeated measures ANOVA revealed an effect of cues (F(4,60)=16.6, P<0.05), no effect of days (F<1) and no interaction (F(16,240)=1.0). Post hoc analyses showed no differences between the auditory cues (all q<1, P>0.05), and a consistent difference between the visual cues (min q=9.1, P<0.05) across the conditioning days. (c) Compound training. A two-way repeated measures ANOVA on the compound probe phase (day 6) found a main effect of compound type (F(4,60)=20.6, P<0.05), a main effect of trial blocks (F(3,45)=6.4, P<0.05), and an interaction (F(12,180)=1.9, P<0.05). The Control differed from Omission but not from Overexpectation (see text). Discriminative responding seen to the visual cues (q=8.41, P<0.05). One-way ANOVA on responding during the compound training phase (days 7–9) revealed an effect of cue on each day (min F(4,60)=16.9, P<0.05), due to differences between the omission and control compounds (see text), and the two visual cues (min q=8.0, P<0.05). (d) Post-reward period of compound probe phase. A two-way repeated measures ANOVA confirms a main effect of compound cues (F(4,60)=12.1, P<0.05), a main effect of trials (F(3,45)=9.5, P<0.05), and an interaction (F(12,180)=4.2, P<0.05). Control differed from overexpectation early but not late in training (see text). Other comparisons were not of interest; (e) Test. A two-way repeated measures ANOVA on test revealed a main effect of cue (F(2,26)=5.0, P<0.05), no main effect of trials (F(2,39)=2.6, P=0.06), and no interaction (F(6, 78)<1, P=0.55). Overexpectation and Omission each differed from Control but not from each other (see text); (a–e) Error bars represent s.e.m. (f) Correlation between the difference in conditioned responding during the post-reward period between overexpectation and control and the difference in conditioned responding between overexpectation and control during test.

