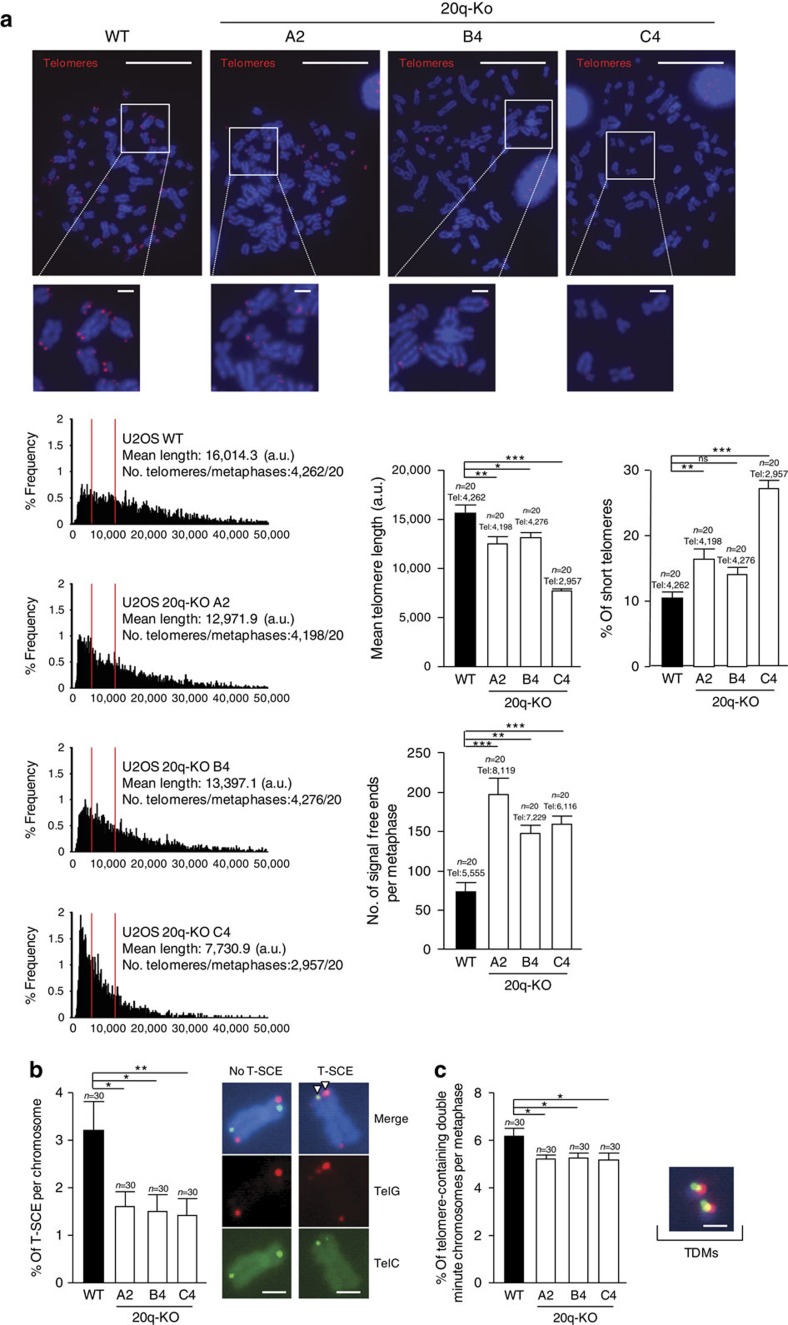
Figure 4. Deletion of the 20q-TERRA locus decreases telomere length and protection in U2OS cells.
(a) Q-FISH images obtained from metaphases spreads from U2OS cells WT and KO for the Chr20q-TERRA locus (clones A4, B4 and C4). (Left graphs) Frequency graphs of telomere length (a.u.) distribution measured in WT and in the 20q-KO cells (clones A4, B4 and C4) from three independent experiments. The mean telomere length and the number of telomeres and metaphases analyzed is shown. The red lines are arbitrary lines placed in the exact same position in each frequency graph to visualize differences between the 20q-KO clones and the WT controls (right graphs) The mean telomere length, the percentage of short telomeres and the quantification of signal-free ends per metaphase are also represented. Short telomeres are considered those in the 10% percentile of the total telomere length distribution. Total number of metaphases used for the statistical analysis is indicated. Scale bar, 10 μm and (zoom) 1 μm. (b) WT and 20q-KO cells were analyzed for T-SCE events with G-rich (green) and C-rich (red) PNA probes. The fraction of chromosome ends with T-SCE obtained from three different experiments was quantified and graphed as the mean values±s.e.m., n=30 metaphases. The number of metaphases analyzed is shown. Only events in which interchange of both colours were quantified (see examples of no-T-SCE and T-SCE). The quantification was carried out by counting the number of events in the same chromosome or in different chromosomes and then normalizing it by the total number of chromosomes observed in each metaphase. Scale bar, 1 μm. (c) Quantification of DNA-containing double minute chromosomes (TDMs) in WT and 20q-KO cells from three different experiments (mean values±s.e.m., n=30 metaphases). An example of TDMs is shown. One-way Anova with Dunnett's post test was used for all statistical analysis (*P<0.05, **P<0.01 and ***P<0.001). Scale bar, 1 μm.

