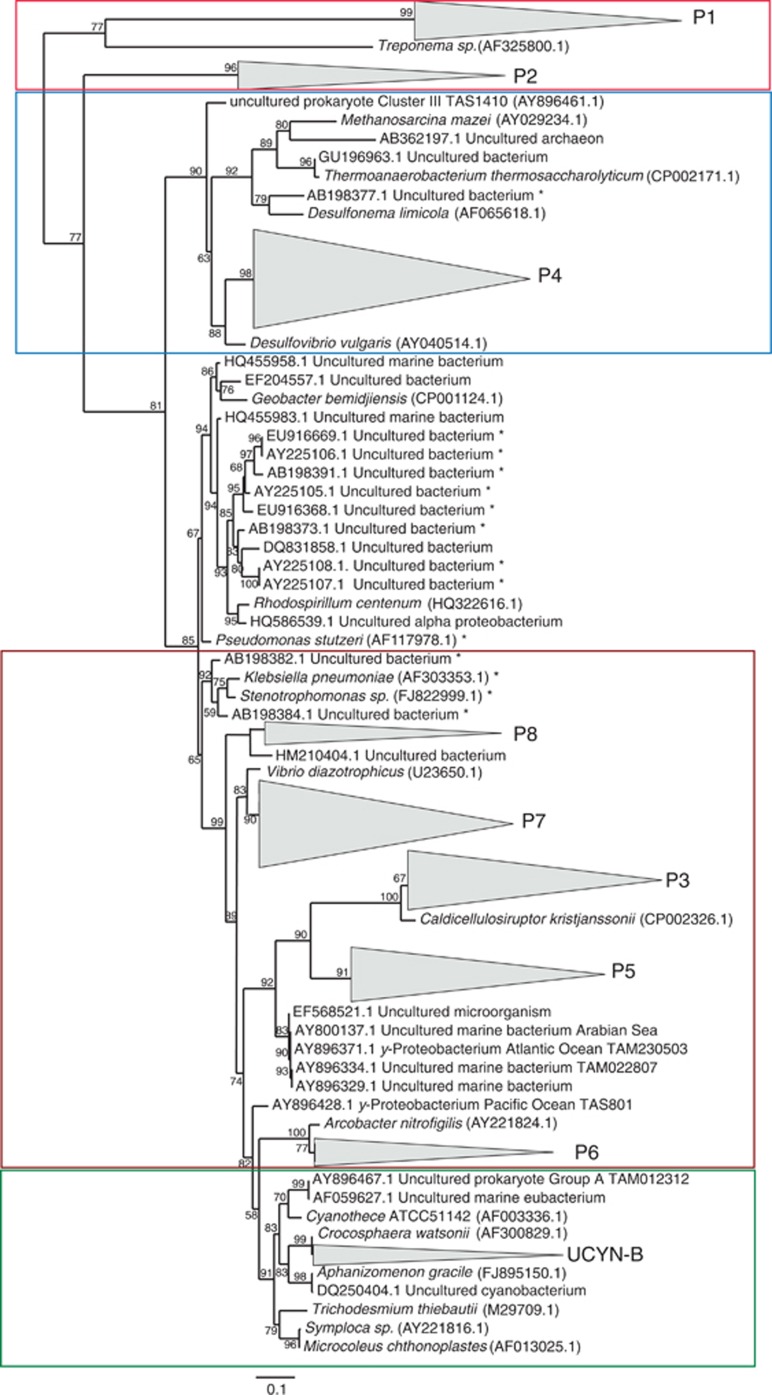
Figure 2.
Phylogenetic tree based on the analysis of ∼600 nifH gene and transcript nucleotide sequences retrieved in this study. The detected clusters are indicated with grey triangles. Cyanobacterial sequences are highlighted in green, proteobacterial sequences are highlighted in brown, Cluster III sequences as defined by Zehr et al. (2003) are shown in blue and two distant clusters are highlighted red. Bootstrapped values (%)>50, out of 100 are shown on branches. The scale bar represents 10% estimated sequence divergence. Sequences marked with an asterisk indicate likely contaminated PCR products previously reported by Turk et al. (2011), the detected clusters are mostly distant from those sequences.

