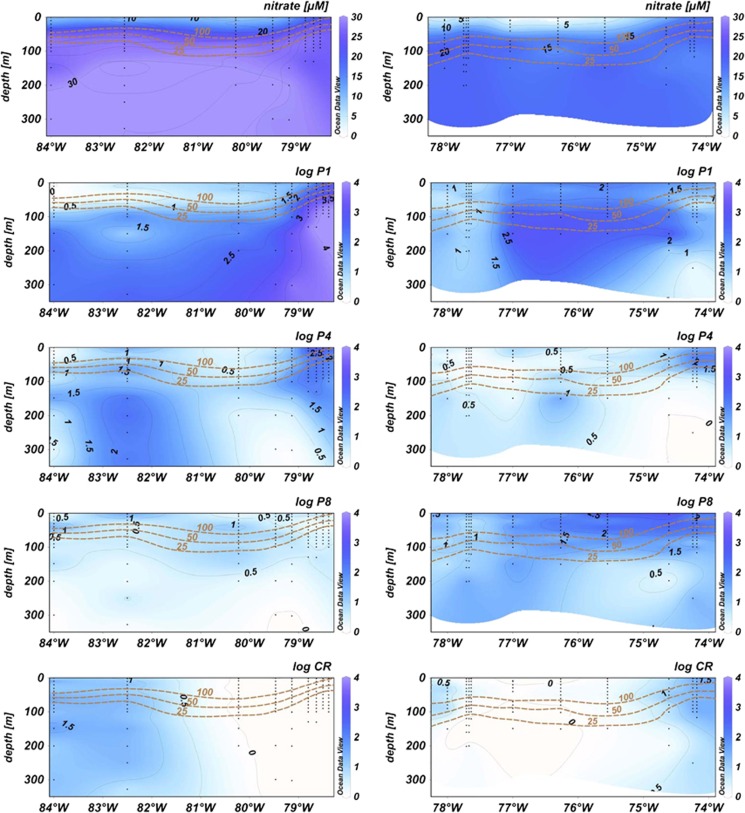
Figure 3.
Distribution of NO3− and the detected nifH clusters: NO3− (μM), nifH clusters P1, P4, P8 and Crocosphaera (log10 copies l−1), the oxycline (μM O2) is indicated with brown contour lines along (left) 10°S and (right) 16°S as marked A and B on the map (Figure 1).

