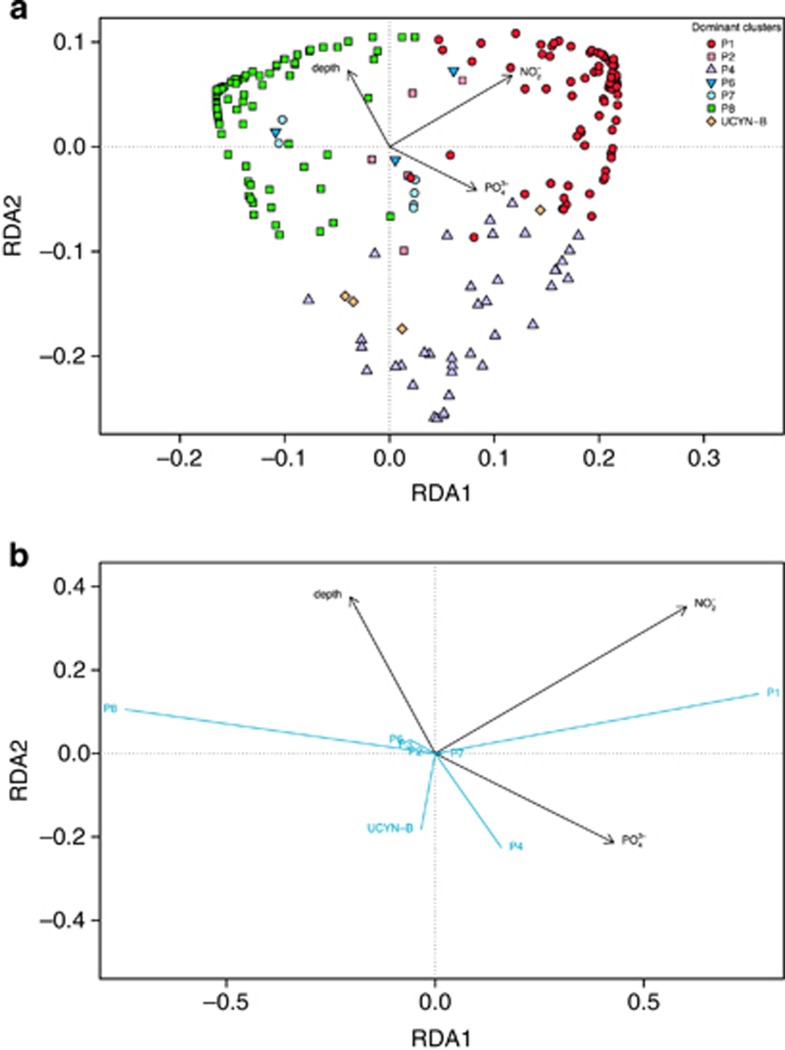
Figure 4.
Redundancy analysis (RDA) of Hellinger-transformed nifH cluster abundances. (a) The distance biplot (scaling 1) shows relations between samples (weighted sums of species scores) and environmental variables in the parsimonious model. (b) Correlation biplot (scaling 2) shows relations between nifH cluster vectors and environmental variables in the parsimonious model.

